Klaipėdos valstybinio jūrų uosto direkcija

Klaipėdos valstybinio jūrų uosto direkcija is a state-owned enterprise established in 1991.The company provides public services in the operation of the Klaipėda State Seaport and in the management of state-owned objects located in the port, ensuring the functioning and competitiveness of the Klaipėda State Seaport in the Eastern Baltic Sea Region. The Company performs the functions provided for in the Law of the Republic of Lithuania on the Klaipėda State Seaport in order to increase the added value for the state and the revenue to the state budget, by properly operating and developing the port infrastructure and by carrying out other activities in order to meet the public interests.
2024/25 GOOD CORPORATE GOVERNANCE INDEX
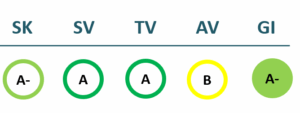
SK – Transparency Dimension
SV – Strategic Management Dimension
TV – Sustainability Dimension
AV – Shareholder Actions Dimension
GI – Good Governance Indicator
Financial results
P/L Statment
| 2022 | 2023 | 2024 | 2025 | |
|---|---|---|---|---|
| Revenue | 60,718 | 58,573 | 60,316 | 63,310 |
| Cost of goods sold | ||||
| Gross profit (loss) | 60,718 | 58,573 | 60,316 | 63,310 |
| Gross profit margin | 100% | 100% | 100% | 100% |
| Operating expenses | 34,671 | 31,986 | 36,628 | 39,327 |
| Operating profit (loss) | 26,047 | 26,587 | 23,688 | 23,983 |
| Operating profit margin | 43% | 45% | 39% | 38% |
| EBITDA | 40,535 | 41,477 | 38,876 | 38,814 |
| EBITDA margin | 67% | 71% | 64% | 61% |
| Net profit (loss) | 24,881 | 27,969 | 25,303 | 24,164 |
| Net profit margin | 41% | 48% | 42% | 38% |
| 2022-06 | 2023-06 | 2024-06 | 2025-06 | |
|---|---|---|---|---|
| Revenue | 29,281 | 29,324 | 28,923 | 30,923 |
| Cost of goods sold | ||||
| Gross profit (loss) | 29,281 | 29,324 | 28,923 | 30,923 |
| Gross profit margin | 100% | 100% | 100% | 100% |
| Operating expenses | 16,261 | 14,674 | 18,620 | 15,626 |
| Operating profit (loss) | 13,020 | 14,650 | 10,303 | 15,297 |
| Operating profit margin | 44% | 50% | 36% | 49% |
| EBITDA | 20,256 | 22,028 | 17,968 | 22,635 |
| EBITDA margin | 69% | 75% | 62% | 73% |
| Net profit (loss) | 11,714 | 11,960 | 11,140 | 13,530 |
| Net profit margin | 40% | 41% | 39% | 44% |
Balance sheet
| 2022 | 2023 | 2024 | 2025 | |
|---|---|---|---|---|
| Non-current assets | 691,084 | 773,464 | 801,676 | 864,498 |
| Intangible assets | 719 | 360 | 461 | 681 |
| Tangible assets | 686,636 | 767,049 | 792,649 | 853,225 |
| Financial assets | ||||
| Other non-current assets | 691,084 | 773,464 | 801,676 | 864,498 |
| Current assets | 39,174 | 41,710 | 37,764 | 40,188 |
| Inventories and prepaid expenses | 287 | 264 | 272 | 443 |
| Accounts receivable in one year | 7,616 | 5,275 | 10,276 | 6,026 |
| Other current assets | 0 | 0 | 0 | |
| Cash and cash equivalents | 31,222 | 36,171 | 27,216 | 33,719 |
| Total assets | 730,258 | 815,174 | 839,440 | 904,686 |
| Equity | 556,155 | 530,027 | 535,775 | 540,961 |
| Grants and subsidies | 126,787 | 222,968 | 227,579 | 227,216 |
| Liabilities | 47,316 | 62,179 | 75,576 | 133,014 |
| Financial liabilities | 32,315 | 54,529 | 50,593 | 109,171 |
| Long-term liabilities | 30,501 | 50,604 | 46,394 | 99,777 |
| Short-term liabilities | 16,815 | 11,575 | 29,182 | 33,237 |
| Equity and liabilities | 730,258 | 815,174 | 839,440 | 904,686 |
| 2022-06 | 2023-06 | 2024-06 | 2025-06 | |
|---|---|---|---|---|
| Non-current assets | 657,847 | 755,175 | 779,896 | 834,170 |
| Intangible assets | 924 | 485 | 411 | 421 |
| Tangible assets | 653,003 | 753,303 | 772,163 | 826,294 |
| Financial assets | ||||
| Other non-current assets | 3,920 | 1,387 | 7,322 | 7,455 |
| Current assets | 19,942 | 22,357 | 33,300 | 12,938 |
| Inventories and prepaid expenses | 495 | 317 | 429 | 316 |
| Accounts receivable in one year | 5,090 | 6,082 | 12,080 | 5,521 |
| Other current assets | 0 | |||
| Cash and cash equivalents | 14,357 | 15,909 | 20,791 | 7,101 |
| Total assets | 677,842 | 777,532 | 813,196 | 847,108 |
| Equity | 543,188 | 514,018 | 521,612 | 530,327 |
| Grants and subsidies | 87,481 | 192,786 | 227,623 | 226,912 |
| Liabilities | 47,173 | 70,728 | 63,961 | 89,869 |
| Financial liabilities | 33,425 | 55,143 | 52,132 | 78,760 |
| Long-term liabilities | 31,738 | 52,528 | 48,728 | 72,417 |
| Short-term liabilities | 15,435 | 18,200 | 15,233 | 17,452 |
| Equity and liabilities | 677,842 | 777,532 | 813,196 | 847,108 |
Financial ratios
| 2022 | 2023 | 2024 | 2025 | |
|---|---|---|---|---|
| Capital return ratios | ||||
| Return on assets (ROA) | 4% | 4% | 3% | 3% |
| Return on equity (ROE) | 4% | 5% | 5% | 4% |
| Return on capital employed (ROCE) | 4% | 5% | 4% | 4% |
| Capital structure and liquidity ratios | ||||
| Debt / asset ratio (D/A) | 0.04 | 0.07 | 0.06 | 0.12 |
| Current Ratio | 2.33 | 3.60 | 1.29 | 1.21 |
| Quick ratio | 2.31 | 3.58 | 1.28 | 1.20 |
| Turnover ratios | ||||
| Asset turnover | 0.08 | 0.07 | 0.07 | 0.07 |
| Fixed asset turnover | 0.09 | 0.08 | 0.08 | 0.07 |
| Equity turnover | 0.11 | 0.11 | 0.11 | 0.12 |
| Profitability ratios | ||||
| EBITDA margin | 67% | 71% | 64% | 61% |
| Operating profit margin | 43% | 45% | 39% | 38% |
| Net profit margin | 40% | 48% | 42% | 38% |
| Other ratios | ||||
| Dividends to the State | 7,666.00 | 19,555.00 | 18,977.10 | 18,123.36 |
| Dividends paid / net profit | 0.31 | 0.70 | 0.75 | 0.75 |
| 2022-06 | 2023-06 | 2024-06 | 2025-06 | |
|---|---|---|---|---|
| Capital return ratios | ||||
| Return on assets (ROA) | 4% | 3% | 3% | 3% |
| Return on equity (ROE) | 5% | 5% | 5% | 5% |
| Return on capital employed (ROCE) | 2% | 3% | 2% | 3% |
| Capital structure and liquidity ratios | ||||
| Debt / asset ratio (D/A) | 0.05 | 0.07 | 0.06 | 0.09 |
| Current Ratio | 1.29 | 1.23 | 2.19 | 0.74 |
| Quick ratio | 1.26 | 1.21 | 2.16 | 0.72 |
| Turnover ratios | ||||
| Asset turnover | 0.04 | 0.04 | 0.04 | 0.04 |
| Fixed asset turnover | 0.04 | 0.04 | 0.04 | 0.04 |
| Equity turnover | 0.05 | 0.06 | 0.06 | 0.06 |
| Profitability ratios | ||||
| EBITDA margin | 69% | 75% | 62% | 73% |
| Operating profit margin | 44% | 50% | 36% | 49% |
| Net profit margin | 40% | 41% | 39% | 44% |
| Other ratios | ||||
| Dividends to the State | ||||
| Dividends paid / net profit |
Financial statments
Expectations of the state
About the company
- Official nameAB Klaipėdos valstybinio jūrų uosto direkcija
- Legal formPublic limited liability company (AB)
- Company code240329870
- SectorTransport and Communications
- Line of businessAdministration of seaport
- Institution representing the StateMinistry of Transport and Communications
- Special obligationsPerformes non-commercial special obligations
- Share belonging to the State100%
- Contacts http://www.portofklaipeda.lt
Return to the State
18.1 EUR milion
ROE
2.8%
Number of employees
223
Financial data provided as at end-December 2024
Management
- Algis LatakasChief Executive Officer
Term of office expires: 2027/06/11
The information is relevant
Board of Directors
CHAIRMAN OF THE BOARD OF DIRECTORS
- Algis LatakasCEO
MEMBERS OF THE BOARD OF DIRECTORS
- Vidmantas PaukštėDirector Of Infrastructure
- Martynas ArmonaitisChief Financial Officer
- Džiugas ŠaulysCommercial Director
Term of office expires: 2027/06/11
The information is relevant
Supervisory board
CHAIRMAN OF THE SUPERVISORY BOARD
- Nemunas BikniusIndependent memeber
SUPERVISORY BOARD MEMBERS
- Aurimas VilkelisIndependent Member
- Gytis MažeikaMinistry of Transport and Communications
- Kristina PetraitienėKlaipėda City Municipality
Term of office expires: 2027/01/01
The information is relevant


