Būsto paskolų draudimas

UAB Būsto paskolų draudimas was established in 1998 with the aim of partially solving the problem of housing finance and boosting the real estate market. The company insured housing loans, including those of citizens entitled to state support, and loans for the modernisation of multi-apartment buildings, thereby participating in the modernisation programme for multi-apartment buildings. Currently, the Company provides insurance protection services under credit insurance contracts concluded in favour of banks or other credit institutions registered in the Republic of Lithuania, which have entered into cooperation agreements with the Company, and is seeking to transfer its rights and obligations under the insurance contracts in accordance with the obligation of the Bank of Lithuania.
2024/25 GOOD CORPORATE GOVERNANCE INDEX
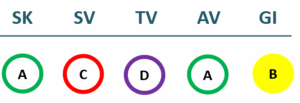
SK – Skaidrumo dimensija
SV – Strateginio valdymo dimensija
TV – Tvarumo dimensija
AV – Akcininko veiksmų dimensija
GI – Gerosios valdysenos rodiklis
Financial results
P/L Statment
| 2022 | 2023 | 2024 | 2025 | |
|---|---|---|---|---|
| Revenue | 211 | 481 | 270 | 316 |
| Cost of goods sold | 1,501 | 80 | -56 | 30 |
| Gross profit (loss) | -1,290 | 400 | 326 | 286 |
| Gross profit margin | -613% | 83% | 121% | 90% |
| Operating expenses | 659 | 531 | 568 | 516 |
| Operating profit (loss) | -1,950 | -130 | -241 | -231 |
| Operating profit margin | -926% | -27% | -89% | -73% |
| EBITDA | 522 | 42 | 24 | 17 |
| EBITDA margin | 248% | 9% | 9% | 5% |
| Net profit (loss) | 156 | 27 | 10 | 2 |
| Net profit margin | 74% | 6% | 4% | 1% |
| 2022-06 | 2023-06 | 2024-06 | 2025-06 | |
|---|---|---|---|---|
| Revenue | 136 | 51 | 55 | 41 |
| Cost of goods sold | -428 | -40 | -151 | -81 |
| Gross profit (loss) | 563 | 91 | 206 | 122 |
| Gross profit margin | 415% | 179% | 374% | 298% |
| Operating expenses | 335 | 248 | 270 | 252 |
| Operating profit (loss) | 228 | -157 | -65 | -131 |
| Operating profit margin | 168% | -310% | -117% | -320% |
| EBITDA | 3,029 | -151 | 199 | -9 |
| EBITDA margin | 2234% | -297% | 362% | -22% |
| Net profit (loss) | 3,082 | -157 | 193 | -15 |
| Net profit margin | 2273% | -309% | 351% | -37% |
Balance sheet
| 2022 | 2023 | 2024 | 2025 | |
|---|---|---|---|---|
| Non-current assets | 429 | 416 | 407 | 396 |
| Intangible assets | 0 | 0 | 0 | 0 |
| Tangible assets | 429 | 416 | 406 | 396 |
| Financial assets | ||||
| Other non-current assets | 429 | 416 | 407 | 396 |
| Current assets | 9,945 | 9,035 | 8,665 | 8,030 |
| Inventories and prepaid expenses | 0 | |||
| Accounts receivable in one year | 47 | 402 | 210 | 74 |
| Other current assets | 8,131 | 7,890 | 7,268 | |
| Cash and cash equivalents | 9,897 | 502 | 564 | 687 |
| Total assets | 10,378 | 9,454 | 9,074 | 8,427 |
| Equity | 5,777 | 5,803 | 5,805 | 5,798 |
| Grants and subsidies | ||||
| Liabilities | 1,765 | 1,183 | 985 | 656 |
| Financial liabilities | 0 | 0 | 0 | 0 |
| Long-term liabilities | ||||
| Short-term liabilities | 1,765 | 1,183 | 985 | 656 |
| Equity and liabilities | 10,378 | 9,454 | 9,074 | 8,427 |
| 2022-06 | 2023-06 | 2024-06 | 2025-06 | |
|---|---|---|---|---|
| Non-current assets | 472 | 422 | 412 | 400 |
| Intangible assets | 1 | 0 | 0 | |
| Tangible assets | 437 | 422 | 412 | 400 |
| Financial assets | 34 | |||
| Other non-current assets | ||||
| Current assets | 10,404 | 9,214 | 8,961 | 8,274 |
| Inventories and prepaid expenses | 93 | 98 | 0 | 0 |
| Accounts receivable in one year | 87 | 125 | 282 | 21 |
| Other current assets | 7,980 | 7,878 | ||
| Cash and cash equivalents | 10,224 | 1,011 | 8,680 | 375 |
| Total assets | 10,881 | 9,641 | 9,380 | 8,681 |
| Equity | 8,703 | 5,620 | 5,987 | 5,780 |
| Grants and subsidies | ||||
| Liabilities | 1,253 | 1,309 | 1,074 | 795 |
| Financial liabilities | 0 | 0 | 0 | 0 |
| Long-term liabilities | ||||
| Short-term liabilities | 1,253 | 1,309 | 1,074 | 795 |
| Equity and liabilities | 10,881 | 9,641 | 9,380 | 8,681 |
Financial ratios
| 2022 | 2023 | 2024 | 2025 | |
|---|---|---|---|---|
| Capital return ratios | ||||
| Return on assets (ROA) | 1% | 0% | 0% | 0% |
| Return on equity (ROE) | 3% | 0% | 0% | 0% |
| Return on capital employed (ROCE) | -34% | -2% | -4% | -4% |
| Capital structure and liquidity ratios | ||||
| Debt / asset ratio (D/A) | 0.00 | 0.00 | 0.00 | 0.00 |
| Current Ratio | 5.63 | 7.64 | 8.80 | 12.23 |
| Quick ratio | 5.63 | 7.64 | 8.80 | 12.23 |
| Turnover ratios | ||||
| Asset turnover | 0.02 | 0.05 | 0.03 | 0.04 |
| Fixed asset turnover | 0.49 | 1.16 | 0.66 | 0.80 |
| Equity turnover | 0.04 | 0.08 | 0.05 | 0.05 |
| Profitability ratios | ||||
| EBITDA margin | 248% | 9% | 9% | 5% |
| Operating profit margin | -926% | -27% | -89% | -73% |
| Net profit margin | 74% | 6% | 4% | 1% |
| Other ratios | ||||
| Dividends to the State | 0.00 | 8.90 | 9.60 | 3.20 |
| Dividends paid / net profit | 0.00 | 0.33 | 0.93 | 1.39 |
| 2022-06 | 2023-06 | 2024-06 | 2025-06 | |
|---|---|---|---|---|
| Capital return ratios | ||||
| Return on assets (ROA) | 23% | -30% | 4% | -2% |
| Return on equity (ROE) | 40% | -43% | 6% | -3% |
| Return on capital employed (ROCE) | 3% | -3% | -1% | -2% |
| Capital structure and liquidity ratios | ||||
| Debt / asset ratio (D/A) | 0.00 | 0.00 | 0.00 | 0.00 |
| Current Ratio | 8.30 | 7.04 | 8.34 | 10.41 |
| Quick ratio | 8.23 | 6.97 | 8.34 | 10.41 |
| Turnover ratios | ||||
| Asset turnover | 0.01 | 0.01 | 0.01 | 0.00 |
| Fixed asset turnover | 0.29 | 0.12 | 0.13 | 0.10 |
| Equity turnover | 0.02 | 0.01 | 0.01 | 0.01 |
| Profitability ratios | ||||
| EBITDA margin | 2234% | -297% | 362% | -22% |
| Operating profit margin | 168% | -310% | -117% | -320% |
| Net profit margin | 2273% | -309% | 351% | -37% |
| Other ratios | ||||
| Dividends to the State | ||||
| Dividends paid / net profit |
Financial statments
Expectations of the state
About the company
- Official nameUAB „Būsto paskolų draudimas“
- Legal formPrivate limited liability company (UAB)
- Company code110076079
- SectorOther
- Line of businessMortgage insurance
- Institution representing the StateMinistry of Finance
- Share belonging to the State100%
- Contacts http://www.bpd.lt/
Return to the State
3 EUR thousand
ROE
0.0%
Number of employees
9
Financial data provided as at end-December 2024
Management
- Egidijus VeličkaChief Executive Officer
Term of office expires: 2031/01/17
The information is relevant
Board of Directors
CHAIRMAN OF THE BOARD OF DIRECTORS
- Šarūnas NedzinskasIndependent member
MEMBERS OF THE BOARD OF DIRECTORS
- Giedrė GečiauskienėIndependent member
- Saulius JokubaitisIndependent member
- Vilija PetronienėMinistry of Finance
- Lolita ŠumskaitėMinistry of Finance
Term of office expires: 2027/08/02
The information is relevant


