Registrų centras

State Enterprise Centre of Registers manages the main information resources of the state – state registers and information systems – in accordance with the procedures and rules established by their managers – the different state institutions. Currently, the Centre of Registers maintains 11 registers of national importance and 13 information systems. The company employs over 1.5 thousand employees, of which about 600 work in the field of registration of objects and transactions, almost 400 in the field of customer service in 50 customer service units across Lithuania, and more than 200 employees in the field of IT and service development. The Centre of Registers is a partner of national master data, a progressive state, society and business.
2024/25 GOOD CORPORATE GOVERNANCE INDEX
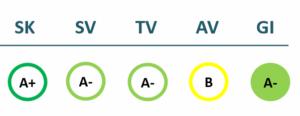
SK – Transparency Dimension
SV – Strategic Management Dimension
TV – Sustainability Dimension
AV – Shareholder Actions Dimension
GI – Good Governance Indicator
Financial results
P/L Statment
| 2022 | 2023 | 2024 | 2025 | |
|---|---|---|---|---|
| Revenue | 64,655 | 58,778 | 62,060 | 91,525 |
| Cost of goods sold | 42,518 | 46,107 | 48,463 | 54,103 |
| Gross profit (loss) | 22,137 | 12,670 | 13,598 | 37,422 |
| Gross profit margin | 34% | 22% | 22% | 41% |
| Operating expenses | 12,554 | 12,522 | 10,497 | 14,948 |
| Operating profit (loss) | 9,583 | 148 | 3,101 | 22,475 |
| Operating profit margin | 15% | 0% | 5% | 25% |
| EBITDA | 12,270 | 4,114 | 8,182 | 29,650 |
| EBITDA margin | 19% | 7% | 13% | 32% |
| Net profit (loss) | 8,368 | 297 | 2,355 | 20,573 |
| Net profit margin | 13% | 1% | 4% | 22% |
| 2022-06 | 2023-06 | 2024-06 | 2025-06 | |
|---|---|---|---|---|
| Revenue | 37,667 | 33,569 | 33,386 | 46,568 |
| Cost of goods sold | 19,111 | 23,031 | 24,058 | 25,631 |
| Gross profit (loss) | 18,557 | 10,538 | 9,328 | 20,937 |
| Gross profit margin | 49% | 31% | 28% | 45% |
| Operating expenses | 5,656 | 6,446 | 6,649 | 6,858 |
| Operating profit (loss) | 12,901 | 4,092 | 2,679 | 14,079 |
| Operating profit margin | 34% | 12% | 8% | 30% |
| EBITDA | 14,151 | 5,962 | 5,067 | 18,826 |
| EBITDA margin | 38% | 18% | 15% | 40% |
| Net profit (loss) | 11,086 | 3,546 | 2,536 | 13,040 |
| Net profit margin | 29% | 11% | 8% | 28% |
Balance sheet
| 2022 | 2023 | 2024 | 2025 | |
|---|---|---|---|---|
| Non-current assets | 47,550 | 66,125 | 67,573 | 70,857 |
| Intangible assets | 14,455 | 18,330 | 20,061 | 20,059 |
| Tangible assets | 29,274 | 44,601 | 44,967 | 45,497 |
| Financial assets | ||||
| Other non-current assets | 47,550 | 66,125 | 67,573 | 70,857 |
| Current assets | 24,178 | 18,201 | 28,734 | 50,558 |
| Inventories and prepaid expenses | 549 | 389 | 83 | 56 |
| Accounts receivable in one year | 15,056 | 14,390 | 17,018 | 22,115 |
| Other current assets | 0 | 0 | 10,000 | |
| Cash and cash equivalents | 8,573 | 3,422 | 11,633 | 18,386 |
| Total assets | 73,491 | 86,003 | 97,899 | 123,941 |
| Equity | 39,670 | 34,632 | 36,651 | 55,647 |
| Grants and subsidies | 10,803 | 14,964 | 19,369 | 18,853 |
| Liabilities | 18,860 | 32,410 | 40,319 | 47,195 |
| Financial liabilities | 2,515 | 18,657 | 23,138 | 23,629 |
| Long-term liabilities | 1,868 | 17,233 | 20,452 | 20,322 |
| Short-term liabilities | 16,992 | 15,177 | 19,866 | 26,873 |
| Equity and liabilities | 73,491 | 86,003 | 97,899 | 123,941 |
| 2022-06 | 2023-06 | 2024-06 | 2025-06 | |
|---|---|---|---|---|
| Non-current assets | 33,050 | 50,770 | 66,199 | 66,297 |
| Intangible assets | 10,603 | 14,613 | 18,332 | 19,677 |
| Tangible assets | 20,961 | 32,764 | 46,855 | 46,187 |
| Financial assets | 0 | |||
| Other non-current assets | 1,486 | 3,392 | 1,012 | 433 |
| Current assets | 33,798 | 20,867 | 26,185 | 42,074 |
| Inventories and prepaid expenses | 512 | 254 | 147 | 63 |
| Accounts receivable in one year | 25,776 | 14,770 | 15,296 | 18,677 |
| Other current assets | 0 | 0 | ||
| Cash and cash equivalents | 7,510 | 5,843 | 10,742 | 23,334 |
| Total assets | 68,699 | 73,762 | 94,482 | 111,069 |
| Equity | 43,730 | 38,949 | 37,092 | 48,143 |
| Grants and subsidies | 9,945 | 12,024 | 17,308 | 18,359 |
| Liabilities | 11,820 | 19,595 | 37,362 | 43,002 |
| Financial liabilities | 512 | 4,190 | 24,160 | 23,176 |
| Long-term liabilities | 239 | 2,985 | 21,731 | 20,312 |
| Short-term liabilities | 11,582 | 16,610 | 15,631 | 22,690 |
| Equity and liabilities | 68,699 | 73,762 | 94,482 | 111,069 |
Financial ratios
| 2022 | 2023 | 2024 | 2025 | |
|---|---|---|---|---|
| Capital return ratios | ||||
| Return on assets (ROA) | 12% | 0% | 3% | 19% |
| Return on equity (ROE) | 20% | 1% | 7% | 45% |
| Return on capital employed (ROCE) | 23% | 0% | 5% | 30% |
| Capital structure and liquidity ratios | ||||
| Debt / asset ratio (D/A) | 0.03 | 0.22 | 0.24 | 0.19 |
| Current Ratio | 1.42 | 1.20 | 1.45 | 1.88 |
| Quick ratio | 1.39 | 1.17 | 1.44 | 1.88 |
| Turnover ratios | ||||
| Asset turnover | 0.88 | 0.68 | 0.63 | 0.74 |
| Fixed asset turnover | 1.36 | 0.89 | 0.92 | 1.29 |
| Equity turnover | 1.63 | 1.70 | 1.69 | 1.64 |
| Profitability ratios | ||||
| EBITDA margin | 19% | 7% | 13% | 32% |
| Operating profit margin | 15% | 0% | 5% | 25% |
| Net profit margin | 13% | 0% | 3% | 22% |
| Other ratios | ||||
| Dividends to the State | 3,724.19 | 58.40 | 1,504.90 | 12,586.69 |
| Dividends paid / net profit | 0.45 | 0.20 | 0.64 | 0.61 |
| 2022-06 | 2023-06 | 2024-06 | 2025-06 | |
|---|---|---|---|---|
| Capital return ratios | ||||
| Return on assets (ROA) | 44% | 1% | -1% | 13% |
| Return on equity (ROE) | 70% | 2% | -2% | 30% |
| Return on capital employed (ROCE) | 29% | 10% | 5% | 21% |
| Capital structure and liquidity ratios | ||||
| Debt / asset ratio (D/A) | 0.01 | 0.06 | 0.26 | 0.21 |
| Current Ratio | 2.92 | 1.26 | 1.68 | 1.85 |
| Quick ratio | 2.87 | 1.24 | 1.67 | 1.85 |
| Turnover ratios | ||||
| Asset turnover | 0.55 | 0.46 | 0.35 | 0.42 |
| Fixed asset turnover | 1.14 | 0.66 | 0.50 | 0.70 |
| Equity turnover | 0.86 | 0.86 | 0.90 | 0.97 |
| Profitability ratios | ||||
| EBITDA margin | 38% | 18% | 15% | 40% |
| Operating profit margin | 34% | 12% | 8% | 30% |
| Net profit margin | 29% | 11% | 8% | 28% |
| Other ratios | ||||
| Dividends to the State | ||||
| Dividends paid / net profit |
Financial statments
Expectations of the state
About the company
- Official nameVĮ Registrų centras
- Legal formState enterprise (VĮ)
- Company code124110246
- SectorOther
- Line of businessManagement of information systems and registers of national importance
- Institution representing the StateMinistry of the Economy and Innovation
- Special obligationsPerformes non-commercial special obligations
- Share belonging to the State100%
- Contacts http://www.registrucentras.lt/
Return to the State
12.6 EUR milion
ROE
18.5%
Number of employees
1,601
Financial data provided as at end-December 2024
Management
- L.e.p. Giedrius CininasActing Chief Executive officer
The information is relevant
Board of Directors
CHAIRMAN OF THE BOARD OF DIRECTORS
- Rasa BalevičienėIndependent member
MEMBERS OF THE BOARD OF DIRECTORS
- Mindaugas KvekšasIndependent member
- Ana ParafinaitėIndependent member
- Andrius ŠemeškevičiusIndependent member
- Nerijus ŠeputisIndependent member
- Ieva BacytėVĮ Registrų centras
- Vaidotas RudokasMinistry of the Economy and Innovation
Term of office expires: 2030/04/14
The information is relevant


