Lietuvos geležinkeliai
Lietuvos paštas is the largest provider of postal services in the country. The company’s main mission is to be a reliable parcel and letter delivery partner connecting Lithuania with the world. Lithuanian Post also operates the second largest network of parcel machines in Lithuania, LP EXPRESS, and provides services for payment of benefits, subscription delivery and remittances.
2024/25 GOOD CORPORATE GOVERNANCE INDEX
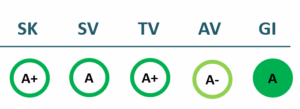
SK – Transparency Dimension
SV – Strategic Management Dimension
TV – Sustainability Dimension
AV – Shareholder Actions Dimension
GI – Good Governance Indicator
Financial results
P/L Statment
| 2022 | 2023 | 2024 | 2025 | |
|---|---|---|---|---|
| Revenue | 432,932 | 452,001 | 496,741 | 514,327 |
| Cost of goods sold | 427,978 | 421,651 | 444,683 | 453,418 |
| Gross profit (loss) | 4,954 | 30,350 | 52,057 | 60,909 |
| Gross profit margin | 1% | 7% | 10% | 12% |
| Operating expenses | 0 | |||
| Operating profit (loss) | 4,954 | 30,350 | 52,057 | 60,909 |
| Operating profit margin | 1% | 7% | 10% | 12% |
| EBITDA | 112,104 | 142,633 | 169,720 | 175,325 |
| EBITDA margin | 26% | 32% | 34% | 34% |
| Net profit (loss) | 1,213 | 21,643 | 37,023 | 43,268 |
| Net profit margin | 0% | 5% | 7% | 8% |
| 2022-06 | 2023-06 | 2024-06 | 2025-06 | |
|---|---|---|---|---|
| Revenue | 201,864 | 211,172 | 243,697 | 241,559 |
| Cost of goods sold | 176,796 | 199,829 | 217,895 | 216,486 |
| Gross profit (loss) | 25,067 | 11,343 | 25,802 | 25,073 |
| Gross profit margin | 12% | 5% | 11% | 10% |
| Operating expenses | 31,457 | |||
| Operating profit (loss) | -6,390 | 11,343 | 25,802 | 25,073 |
| Operating profit margin | -3% | 5% | 11% | 10% |
| EBITDA | 43,663 | 65,938 | 81,652 | 84,819 |
| EBITDA margin | 22% | 31% | 34% | 35% |
| Net profit (loss) | -6,561 | 8,989 | 20,386 | 19,218 |
| Net profit margin | -3% | 4% | 8% | 8% |
Balance sheet
| 2022 | 2023 | 2024 | 2025 | |
|---|---|---|---|---|
| Non-current assets | 1,991,316 | 2,198,208 | 2,417,722 | 2,639,961 |
| Intangible assets | 28,892 | 29,590 | 31,215 | 35,514 |
| Tangible assets | 1,951,669 | 2,157,589 | 2,376,407 | 2,596,744 |
| Financial assets | 7,436 | 7,261 | 7,285 | 5,641 |
| Other non-current assets | 1,991,316 | 2,198,208 | 2,417,722 | 2,639,961 |
| Current assets | 283,412 | 293,604 | 268,124 | 372,503 |
| Inventories and prepaid expenses | 30,577 | 25,024 | 37,849 | 34,241 |
| Accounts receivable in one year | 37,670 | 32,914 | 53,736 | 76,706 |
| Other current assets | 0 | 0 | 0 | |
| Cash and cash equivalents | 213,434 | 228,566 | 176,539 | 261,556 |
| Total assets | 2,280,260 | 2,498,469 | 2,694,443 | 3,022,939 |
| Equity | 1,161,504 | 1,174,286 | 1,197,208 | 1,207,139 |
| Grants and subsidies | 809,164 | 983,466 | 1,119,665 | 1,316,983 |
| Liabilities | 286,979 | 312,152 | 339,944 | 441,156 |
| Financial liabilities | 159,914 | 139,808 | 137,339 | 212,889 |
| Long-term liabilities | 167,762 | 149,826 | 170,536 | 231,416 |
| Short-term liabilities | 119,217 | 162,326 | 169,408 | 209,741 |
| Equity and liabilities | 2,280,260 | 2,498,469 | 2,694,443 | 3,022,939 |
| 2022-06 | 2023-06 | 2024-06 | 2025-06 | |
|---|---|---|---|---|
| Non-current assets | 1,920,003 | 2,071,782 | 2,224,667 | 2,491,878 |
| Intangible assets | 26,837 | 29,377 | 29,546 | 30,527 |
| Tangible assets | 1,881,913 | 2,031,530 | 2,184,632 | 2,451,805 |
| Financial assets | 7,537 | 7,354 | 7,653 | 6,649 |
| Other non-current assets | 3,717 | 3,521 | 2,836 | 2,898 |
| Current assets | 149,988 | 250,438 | 266,836 | 198,045 |
| Inventories and prepaid expenses | 44,475 | 40,710 | 24,632 | 36,108 |
| Accounts receivable in one year | 65,304 | 61,631 | 90,805 | 93,014 |
| Other current assets | 1,500 | |||
| Cash and cash equivalents | 40,209 | 145,134 | 148,220 | 65,249 |
| Total assets | 2,081,696 | 2,328,261 | 2,502,301 | 2,699,994 |
| Equity | 1,153,754 | 1,170,201 | 1,180,658 | 1,183,119 |
| Grants and subsidies | 629,569 | 813,725 | 984,224 | 1,139,442 |
| Liabilities | 279,000 | 318,105 | 300,235 | 344,667 |
| Financial liabilities | 165,993 | 142,939 | 130,435 | 147,636 |
| Long-term liabilities | 170,635 | 156,512 | 158,635 | 189,093 |
| Short-term liabilities | 108,365 | 161,593 | 141,600 | 155,574 |
| Equity and liabilities | 2,081,696 | 2,328,261 | 2,502,301 | 2,699,994 |
Financial ratios
| 2022 | 2023 | 2024 | 2025 | |
|---|---|---|---|---|
| Capital return ratios | ||||
| Return on assets (ROA) | 0% | 1% | 1% | 2% |
| Return on equity (ROE) | 0% | 2% | 3% | 4% |
| Return on capital employed (ROCE) | 0% | 2% | 4% | 4% |
| Capital structure and liquidity ratios | ||||
| Debt / asset ratio (D/A) | 0.07 | 0.06 | 0.05 | 0.07 |
| Current Ratio | 2.38 | 1.81 | 1.58 | 1.78 |
| Quick ratio | 2.12 | 1.65 | 1.36 | 1.61 |
| Turnover ratios | ||||
| Asset turnover | 0.19 | 0.18 | 0.18 | 0.17 |
| Fixed asset turnover | 0.22 | 0.21 | 0.21 | 0.19 |
| Equity turnover | 0.37 | 0.38 | 0.41 | 0.43 |
| Profitability ratios | ||||
| EBITDA margin | 26% | 32% | 34% | 34% |
| Operating profit margin | 1% | 7% | 10% | 12% |
| Net profit margin | 0% | 5% | 7% | 8% |
| Other ratios | ||||
| Dividends to the State | 0.00 | 13,022.25 | 33,283.89 | 25,633.50 |
| Dividends paid / net profit | 0.00 | 0.60 | 0.90 | 0.59 |
| 2022-06 | 2023-06 | 2024-06 | 2025-06 | |
|---|---|---|---|---|
| Capital return ratios | ||||
| Return on assets (ROA) | 1% | 1% | 1% | 1% |
| Return on equity (ROE) | 2% | 1% | 3% | 3% |
| Return on capital employed (ROCE) | -0% | 1% | 2% | 2% |
| Capital structure and liquidity ratios | ||||
| Debt / asset ratio (D/A) | 0.08 | 0.06 | 0.05 | 0.05 |
| Current Ratio | 1.38 | 1.55 | 1.88 | 1.27 |
| Quick ratio | 0.97 | 1.30 | 1.71 | 1.04 |
| Turnover ratios | ||||
| Asset turnover | 0.10 | 0.09 | 0.10 | 0.09 |
| Fixed asset turnover | 0.11 | 0.10 | 0.11 | 0.10 |
| Equity turnover | 0.17 | 0.18 | 0.21 | 0.20 |
| Profitability ratios | ||||
| EBITDA margin | 22% | 31% | 34% | 35% |
| Operating profit margin | -3% | 5% | 11% | 10% |
| Net profit margin | -3% | 4% | 8% | 8% |
| Other ratios | ||||
| Dividends to the State | ||||
| Dividends paid / net profit |
Financial statments
Expectations of the state
About the company
- Official nameAB „Lietuvos geležinkeliai“ įmonių grupė
- Legal formPublic limited liability company (AB)
- Company code110053842
- SectorTransport and Communications
- Line of businessRailways
- Institution representing the StateMinistry of Transport and Communications
- Special obligationsPerformes non-commercial special obligations
- Share belonging to the State100%
- Contacts http://www.litrail.lt
Return to the State
25.6 EUR milion
ROE
1.5%
Number of employees
5,617
Financial data provided as at end-December 2024
Management
- L. e. p. Arūnas RumskasChief Executive Officer
The information is relevant
Board of Directors
CHAIRMAN OF THE BOARD OF DIRECTORS
- Robertas VyšniauskasIndependent member
MEMBERS OF THE BOARD OF DIRECTORS
- Tomas ZdanavičiusIndependent member
- Michael FohrerIndependent member
- Peter NielsenIndependent member
- Aurimas Tomas StaškevičiusIndependent member
- Agnė Amelija MikalonėMinistry of Transport and Communications
- Saulius KerzaMinistry of Transport and Communications
Term of office expires: 2029/07/20
The information is relevant


