KN Energies

KN has grown from the role of the operator of Lithuanian oil and LNG terminals and is becoming a player in the international LNG market. The company provides the market with accumulated knowledge of terminal operation and development and connects energy markets, enabling customers around the world to source and trade energy resources. KN sets itself the ambitious goal of transforming the company that has ensured Lithuania’s energy independence into a leading oil and LNG service center operator in the region and fostering a safety culture, as well as an internationally valued LNG project partner.
2024/25 GOOD CORPORATE GOVERNANCE INDEX
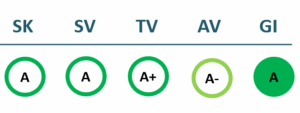
SK – Transparency Dimension
SV – Strategic Management Dimension
TV – Sustainability Dimension
AV – Shareholder Actions Dimension
GI – Good Governance Indicator
Financial results
P/L Statment
| 2022 | 2023 | 2024 | 2025 | |
|---|---|---|---|---|
| Revenue | 77,818 | 83,525 | 93,655 | 105,209 |
| Cost of goods sold | 57,703 | 60,024 | 54,518 | 62,941 |
| Gross profit (loss) | 20,115 | 23,501 | 39,137 | 42,268 |
| Gross profit margin | 26% | 28% | 42% | 40% |
| Operating expenses | 0 | 10,963 | 14,765 | 15,271 |
| Operating profit (loss) | 11,683 | 12,538 | 24,372 | 26,997 |
| Operating profit margin | 15% | 15% | 26% | 26% |
| EBITDA | 34,857 | 39,013 | 43,652 | 46,939 |
| EBITDA margin | 45% | 47% | 47% | 45% |
| Net profit (loss) | -5,904 | 13,226 | 15,366 | 18,211 |
| Net profit margin | -8% | 16% | 16% | 17% |
| 2022-06 | 2023-06 | 2024-06 | 2025-06 | |
|---|---|---|---|---|
| Revenue | 35,976 | 42,398 | 42,614 | 51,083 |
| Cost of goods sold | 26,958 | 31,824 | 25,382 | 30,845 |
| Gross profit (loss) | 9,018 | 10,574 | 17,232 | 20,238 |
| Gross profit margin | 25% | 25% | 40% | 40% |
| Operating expenses | 0 | 0 | 0 | 0 |
| Operating profit (loss) | 5,206 | 5,222 | 9,955 | 13,810 |
| Operating profit margin | 14% | 12% | 23% | 27% |
| EBITDA | 16,885 | 16,784 | 17,128 | 28,039 |
| EBITDA margin | 47% | 40% | 40% | 55% |
| Net profit (loss) | -13,848 | 8,100 | 1,459 | 8,588 |
| Net profit margin | -38% | 19% | 3% | 17% |
Balance sheet
| 2022 | 2023 | 2024 | 2025 | |
|---|---|---|---|---|
| Non-current assets | 481,050 | 457,271 | 446,433 | 435,094 |
| Intangible assets | 793 | 643 | 469 | 618 |
| Tangible assets | 145,800 | 140,709 | 426,752 | 415,804 |
| Financial assets | 261 | 207 | 115 | 86 |
| Other non-current assets | 481,050 | 457,271 | 446,433 | 435,094 |
| Current assets | 92,883 | 96,792 | 100,697 | 119,864 |
| Inventories and prepaid expenses | 2,120 | 1,608 | 1,937 | 1,628 |
| Accounts receivable in one year | 15,069 | 13,326 | 31,158 | 42,571 |
| Other current assets | 3,271 | 62,323 | 50,399 | 63,304 |
| Cash and cash equivalents | 72,423 | 19,535 | 17,203 | 12,361 |
| Total assets | 573,933 | 554,063 | 547,130 | 554,958 |
| Equity | 139,100 | 153,248 | 163,128 | 172,592 |
| Grants and subsidies | 5,468 | 5,115 | 4,942 | 6,198 |
| Liabilities | 423,702 | 388,337 | 372,277 | 369,268 |
| Financial liabilities | 409,388 | 374,465 | 346,018 | 336,306 |
| Long-term liabilities | 358,142 | 183,980 | 326,859 | 309,558 |
| Short-term liabilities | 65,560 | 204,357 | 45,418 | 59,710 |
| Equity and liabilities | 573,933 | 554,063 | 547,130 | 554,958 |
| 2022-06 | 2023-06 | 2024-06 | 2025-06 | |
|---|---|---|---|---|
| Non-current assets | 490,010 | 469,676 | 457,612 | 436,445 |
| Intangible assets | 859 | 700 | 530 | 388 |
| Tangible assets | 148,233 | 142,383 | 146,579 | 417,005 |
| Financial assets | 234 | 111 | 138 | 117 |
| Other non-current assets | 340,684 | 326,482 | 310,365 | 18,935 |
| Current assets | 83,534 | 91,752 | 83,435 | 89,533 |
| Inventories and prepaid expenses | 2,197 | 1,999 | 1,796 | 1,719 |
| Accounts receivable in one year | 14,598 | 58,959 | 14,396 | 15,141 |
| Other current assets | 3,271 | 3,321 | 48,234 | 51,282 |
| Cash and cash equivalents | 63,468 | 27,473 | 19,009 | 21,391 |
| Total assets | 573,544 | 561,428 | 541,047 | 525,978 |
| Equity | 131,150 | 147,231 | 148,420 | 163,085 |
| Grants and subsidies | 5,564 | 5,285 | 5,113 | 4,768 |
| Liabilities | 433,894 | 402,991 | 385,252 | 352,207 |
| Financial liabilities | 420,086 | 391,628 | 370,753 | 336,150 |
| Long-term liabilities | 368,632 | 336,405 | 194,321 | 318,373 |
| Short-term liabilities | 65,262 | 66,586 | 190,931 | 33,834 |
| Equity and liabilities | 573,544 | 561,428 | 541,047 | 525,978 |
Financial ratios
| 2022 | 2023 | 2024 | 2025 | |
|---|---|---|---|---|
| Capital return ratios | ||||
| Return on assets (ROA) | -1% | 2% | 3% | 3% |
| Return on equity (ROE) | -4% | 9% | 10% | 11% |
| Return on capital employed (ROCE) | 2% | 4% | 5% | 6% |
| Capital structure and liquidity ratios | ||||
| Debt / asset ratio (D/A) | 0.71 | 0.68 | 0.63 | 0.61 |
| Current Ratio | 1.42 | 0.47 | 2.22 | 2.01 |
| Quick ratio | 1.38 | 0.47 | 2.17 | 1.98 |
| Turnover ratios | ||||
| Asset turnover | 0.14 | 0.15 | 0.17 | 0.19 |
| Fixed asset turnover | 0.16 | 0.18 | 0.21 | 0.24 |
| Equity turnover | 0.56 | 0.55 | 0.57 | 0.61 |
| Profitability ratios | ||||
| EBITDA margin | 45% | 47% | 47% | 45% |
| Operating profit margin | 15% | 15% | 26% | 26% |
| Net profit margin | -8% | 16% | 16% | 17% |
| Other ratios | ||||
| Dividends to the State | 0.00 | 3,623.50 | 6,248.36 | 7,878.94 |
| Dividends paid / net profit | 0.00 | 0.27 | 0.41 | 0.43 |
| 2022-06 | 2023-06 | 2024-06 | 2025-06 | |
|---|---|---|---|---|
| Capital return ratios | ||||
| Return on assets (ROA) | -12% | 3% | 1% | 4% |
| Return on equity (ROE) | -43% | 12% | 4% | 14% |
| Return on capital employed (ROCE) | 1% | 1% | 3% | 3% |
| Capital structure and liquidity ratios | ||||
| Debt / asset ratio (D/A) | 0.73 | 0.70 | 0.69 | 0.64 |
| Current Ratio | 1.28 | 1.38 | 0.44 | 2.65 |
| Quick ratio | 1.25 | 1.35 | 0.43 | 2.60 |
| Turnover ratios | ||||
| Asset turnover | 0.06 | 0.08 | 0.08 | 0.10 |
| Fixed asset turnover | 0.07 | 0.09 | 0.09 | 0.12 |
| Equity turnover | 0.27 | 0.29 | 0.29 | 0.31 |
| Profitability ratios | ||||
| EBITDA margin | 47% | 40% | 40% | 55% |
| Operating profit margin | 14% | 12% | 23% | 27% |
| Net profit margin | -38% | 19% | 3% | 17% |
| Other ratios | ||||
| Dividends to the State | ||||
| Dividends paid / net profit |
Financial statments
2015 m. 12 mėn. tarpinės ataskaitos
2015 m. 9 mėn. tarpinės ataskaitos
2015 m. 6 mėn. tarpinės ataskaitos
2015 m. 3 mėn. tarpinės ataskaitos
2014 m. metinės ataskaitos
2014 m. 12 mėn. tarpinės ataskaitos
2014 m. 3 mėn. tarpinės ataskaitos
2014 m. 9 mėn. tarpinės ataskaitos
2014 m. 6 mėn. tarpinės ataskaitos
Expectations of the state
About the company
- Official nameAB „KN Energies“
- Legal formPublic limited liability company (AB)
- Company code110648893
- SectorEnergy
- Line of businessExport and import of oil and oil products
- Institution representing the StateMinistry of Energy
- Share belonging to the State72.47%
- Contacts https://www.knenergies.lt
Return to the State
7.9 EUR milion
ROE
3.3%
Number of employees
416
Financial data provided as at end-December 2024
Management
- Darius ŠilenskisChief Executive Officer
Term of office expires: 2029/11/12
The information is relevant
Board of Directors
CHAIRMAN OF THE BOARD OF DIRECTORS
- Jūratė LingienėIndependent member
MEMBERS OF THE BOARD OF DIRECTORS
- Roderick Guy MasonIndependent member
- Lasse BolanderIndependent member
- Casper Willem Maurits PieperIndependent member
- Karolis ŠvaikauskasMinistry of Energy
- Aurimas SalapėtaMinistry of Energy
Term of office expires: 2030/04/29
The information is relevant


