Ignalinos atominė elektrinė (Altra)

The construction of the Ignalina Nuclear Power Plant (INPP) began in 1974. In fulfilling Lithuanias obligations under the Treaty of Accession to the European Union,2009 December 31 INPP has completely cut off electricity production. From the electricity producer it became a company that ceases its activity but operates a nuclear facility. From 2010 January 1 decommissioning became the main INPP activity. The main goal of the company is to terminate the operation of the nuclear power plant with RBMK reactors in a safe, timely and efficient manner. On October 30, 2025, the Ignalina Nuclear Power Plant introduced its new name – “Altra”, symbolizing Lithuania’s nuclear energy transformation.
2024/25 GOOD CORPORATE GOVERNANCE INDEX
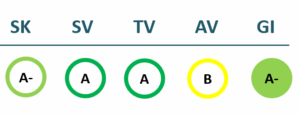
SK – Transparency Dimension
SV – Strategic Management Dimension
TV – Sustainability Dimension
AV – Shareholder Actions Dimension
GI – Good Governance Indicator
Financial results
P/L Statment
| 2022 | 2023 | 2024 | 2025 | |
|---|---|---|---|---|
| Revenue | 134 | 178 | 91 | 74 |
| Cost of goods sold | ||||
| Gross profit (loss) | 134 | 178 | 91 | 74 |
| Gross profit margin | 100% | 100% | 100% | 100% |
| Operating expenses | -5,775 | -9,099 | 3,320 | -7,420 |
| Operating profit (loss) | 5,909 | 9,277 | -3,228 | 7,493 |
| Operating profit margin | 4416% | 5221% | -3532% | 10140% |
| EBITDA | 6,506 | 8,700 | -2,720 | 7,057 |
| EBITDA margin | 4862% | 4897% | -2976% | 9550% |
| Net profit (loss) | 5,322 | 7,956 | -3,397 | 6,408 |
| Net profit margin | 3977% | 4478% | -3716% | 8671% |
| 2022-06 | 2023-06 | 2024-06 | 2025-06 | |
|---|---|---|---|---|
| Revenue | 49 | 250 | 71 | 36 |
| Cost of goods sold | ||||
| Gross profit (loss) | 49 | 250 | 71 | 36 |
| Gross profit margin | 100% | 100% | 100% | 100% |
| Operating expenses | 7,845 | 4,015 | 831 | 873 |
| Operating profit (loss) | -7,796 | -3,766 | -760 | -837 |
| Operating profit margin | -15877% | -1507% | -1067% | -2326% |
| EBITDA | -8,326 | -2,780 | 5 | -341 |
| EBITDA margin | -16958% | -1113% | 7% | -947% |
| Net profit (loss) | -8,618 | -3,746 | -416 | -669 |
| Net profit margin | -17551% | -1499% | -584% | -1858% |
Balance sheet
| 2022 | 2023 | 2024 | 2025 | |
|---|---|---|---|---|
| Non-current assets | 170,744 | 153,379 | 145,383 | 153,897 |
| Intangible assets | 430 | 439 | 340 | 299 |
| Tangible assets | 168,014 | 152,939 | 145,043 | 153,598 |
| Financial assets | 2,300 | |||
| Other non-current assets | 170,744 | 153,379 | 145,383 | 153,897 |
| Current assets | 73,061 | 79,074 | 85,952 | 85,101 |
| Inventories and prepaid expenses | 18,421 | 18,413 | 23,185 | 20,407 |
| Accounts receivable in one year | 24,905 | 27,878 | 31,224 | 33,609 |
| Other current assets | 11,554 | 5,471 | 0 | 1,109 |
| Cash and cash equivalents | 18,181 | 27,313 | 31,543 | 29,976 |
| Total assets | 244,012 | 232,695 | 232,015 | 239,839 |
| Equity | 23,021 | 30,977 | 27,574 | 33,956 |
| Grants and subsidies | 170,928 | 157,556 | 160,551 | 169,795 |
| Liabilities | 13,511 | 17,744 | 14,530 | 17,502 |
| Financial liabilities | 0 | 0 | 0 | 0 |
| Long-term liabilities | ||||
| Short-term liabilities | 13,511 | 17,744 | 14,530 | 17,502 |
| Equity and liabilities | 244,012 | 232,695 | 232,015 | 239,839 |
| 2022-06 | 2023-06 | 2024-06 | 2025-06 | |
|---|---|---|---|---|
| Non-current assets | 195,319 | 166,019 | 149,916 | 145,089 |
| Intangible assets | 412 | 314 | 344 | 283 |
| Tangible assets | 180,420 | 163,401 | 149,573 | 144,806 |
| Financial assets | 13,831 | 2,304 | ||
| Other non-current assets | 656 | |||
| Current assets | 239,941 | 255,540 | 79,755 | 85,860 |
| Inventories and prepaid expenses | 18,995 | 17,951 | 20,472 | 25,082 |
| Accounts receivable in one year | 210,954 | 217,093 | 30,692 | 36,886 |
| Other current assets | 3,003 | 16,434 | 10,804 | 108 |
| Cash and cash equivalents | 6,989 | 4,061 | 17,787 | 23,160 |
| Total assets | 435,624 | 421,959 | 230,028 | 231,279 |
| Equity | 10,071 | 19,276 | 30,561 | 26,905 |
| Grants and subsidies | 355,890 | 357,792 | 157,632 | 163,095 |
| Liabilities | 10,104 | 8,356 | 15,425 | 11,936 |
| Financial liabilities | 0 | 0 | 0 | 0 |
| Long-term liabilities | ||||
| Short-term liabilities | 10,104 | 8,356 | 15,425 | 11,936 |
| Equity and liabilities | 435,624 | 421,959 | 230,028 | 231,279 |
Financial ratios
| 2022 | 2023 | 2024 | 2025 | |
|---|---|---|---|---|
| Capital return ratios | ||||
| Return on assets (ROA) | 1% | 3% | -1% | 3% |
| Return on equity (ROE) | 26% | 29% | -12% | 21% |
| Return on capital employed (ROCE) | 26% | 30% | -12% | 22% |
| Capital structure and liquidity ratios | ||||
| Debt / asset ratio (D/A) | 0.00 | 0.00 | 0.00 | 0.00 |
| Current Ratio | 5.41 | 4.46 | 5.92 | 4.86 |
| Quick ratio | 4.04 | 3.42 | 4.32 | 3.70 |
| Turnover ratios | ||||
| Asset turnover | 0.00 | 0.00 | 0.00 | 0.00 |
| Fixed asset turnover | 0.00 | 0.00 | 0.00 | 0.00 |
| Equity turnover | 0.01 | 0.01 | 0.00 | 0.00 |
| Profitability ratios | ||||
| EBITDA margin | 4862% | 4897% | -2976% | 9550% |
| Operating profit margin | 4416% | 5221% | -3532% | 10140% |
| Net profit margin | 3977% | 4478% | -3716% | 8671% |
| Other ratios | ||||
| Dividends to the State | 0.00 | 0.00 | 0.00 | 0.00 |
| Dividends paid / net profit | 0.00 | 0.00 | 0.00 | 0.00 |
| 2022-06 | 2023-06 | 2024-06 | 2025-06 | |
|---|---|---|---|---|
| Capital return ratios | ||||
| Return on assets (ROA) | -1% | 2% | 3% | -2% |
| Return on equity (ROE) | -53% | 69% | 45% | -13% |
| Return on capital employed (ROCE) | -77% | -20% | -2% | -3% |
| Capital structure and liquidity ratios | ||||
| Debt / asset ratio (D/A) | 0.00 | 0.00 | 0.00 | 0.00 |
| Current Ratio | 23.75 | 30.58 | 5.17 | 7.19 |
| Quick ratio | 21.87 | 28.43 | 3.84 | 5.09 |
| Turnover ratios | ||||
| Asset turnover | 0.00 | 0.00 | 0.00 | 0.00 |
| Fixed asset turnover | 0.00 | 0.00 | 0.00 | 0.00 |
| Equity turnover | 0.00 | 0.01 | 0.00 | 0.00 |
| Profitability ratios | ||||
| EBITDA margin | -16958% | -1113% | 7% | -947% |
| Operating profit margin | -15877% | -1507% | -1067% | -2326% |
| Net profit margin | -17551% | -1499% | -584% | -1858% |
| Other ratios | ||||
| Dividends to the State | ||||
| Dividends paid / net profit |
Financial statments
Expectations of the state
About the company
- Official nameVĮ Ignalinos atominė elektrinė
- Legal formState enterprise (VĮ)
- Company code255450080
- SectorEnergy
- Line of businessShutdown of Ignalina nuclear power plant
- Institution representing the StateMinistry of Energy
- Special obligationsPerformes non-commercial special obligations
- Share belonging to the State100%
- Contacts https://altra.lt/
ROE
2.7%
Number of employees
1,491
Financial data provided as at end-December 2024
Management
- Linas BaužysChief Executive officer
Term of office expires: 2028/10/02
The information is relevant
Board of Directors
CHAIRMAN OF THE BOARD OF DIRECTORS
- Dr. Jurgita Radzevičė Independent member
MEMBERS OF THE BOARD OF DIRECTORS
- Laimonas BelickasIndependent member
- Karolis SankovskiIndependent member
- Patricija Ceiko Ministry of Energy
Term of office expires: 2028/04/23
The information is relevant


