Lietuvos radijo ir televizijos centras

AB Lietuvos radijo ir televizijos centras (Telecentras) is a state-owned joint-stock company, which is the largest operator of free-to-air radio and television programmes in Lithuania. The company also provides data transmission, data centres, infrastructure rental, live broadcasts to studios and other services. The company owns the tallest building in Lithuania, the Vilnius TV Tower.
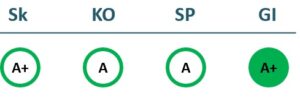
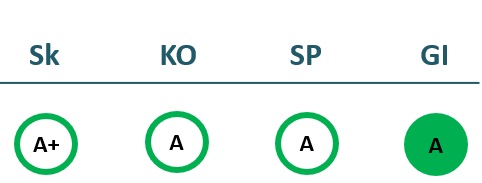
2022/23 GOOD CORPORATE GOVERNANCE INDEX

2021/22 GOOD CORPORATE GOVERNANCE INDEX

Sk – Transparency dimension
KO – Board dimension
SP – Strategic planning and target achievement dimension
GI – Good governance ratio
Financial results
P/L Statment
| 2020 | 2021 | 2022 | 2023 | |
|---|---|---|---|---|
| Revenue | 20,496 | 9,652 | 13,040 | 16,524 |
| Cost of goods sold | 14,361 | 5,937 | 8,932 | 12,499 |
| Gross profit (loss) | 6,135 | 3,716 | 4,108 | 4,025 |
| Gross profit margin | 30% | 38% | 31% | 24% |
| Operating expenses | 5,218 | 3,234 | 3,004 | 1,852 |
| Operating profit (loss) | 18 | 404 | 967 | 885 |
| Operating profit margin | 0% | 4% | 7% | 5% |
| EBITDA | 5,383 | 16,742 | 3,885 | 4,076 |
| EBITDA margin | 26% | 173% | 30% | 25% |
| Net profit (loss) | 209 | 12,344 | 1,091 | 1,558 |
| Net profit margin | 1% | 128% | 8% | 9% |
| 2020-06 | 2021-06 | 2022-06 | 2023-06 | |
|---|---|---|---|---|
| Revenue | 9,994 | 4,407 | 5,838 | 7,773 |
| Cost of goods sold | 7,173 | 2,530 | 4,074 | 6,466 |
| Gross profit (loss) | 2,821 | 1,877 | 1,764 | 1,308 |
| Gross profit margin | 28% | 43% | 30% | 17% |
| Operating expenses | 2,498 | 1,581 | 1,194 | 706 |
| Operating profit (loss) | -11 | 283 | 516 | 202 |
| Operating profit margin | -0% | 6% | 9% | 3% |
| EBITDA | 2,638 | 15,566 | 1,817 | 1,502 |
| EBITDA margin | 26% | 353% | 31% | 19% |
| Net profit (loss) | 44 | 11,511 | 380 | 339 |
| Net profit margin | 0% | 261% | 7% | 4% |
Balance sheet
| 2020 | 2021 | 2022 | 2023 | |
|---|---|---|---|---|
| Non-current assets | 28,474 | 22,238 | 34,243 | 48,249 |
| Intangible assets | 551 | 188 | 328 | 261 |
| Tangible assets | 27,863 | 21,997 | 29,552 | 47,639 |
| Financial assets | 40 | 0 | 4,109 | 0 |
| Other non-current assets | 20 | 53 | 254 | 349 |
| Current assets | 27,228 | 37,154 | 17,497 | 3,874 |
| Inventories and prepaid expenses | 600 | 42 | 28 | 48 |
| Accounts receivable in one year | 3,540 | 1,175 | 1,079 | 2,415 |
| Other current assets | ||||
| Cash and cash equivalents | 23,089 | 35,938 | 16,390 | 1,412 |
| Total assets | 55,702 | 59,392 | 51,740 | 52,123 |
| Equity | 31,791 | 45,259 | 38,305 | 39,836 |
| Grants and subsidies | 95 | 90 | ||
| Liabilities | 23,712 | 14,023 | 13,200 | 12,037 |
| Financial liabilities | 1,183 | 1,159 | 1,334 | 2,952 |
| Long-term liabilities | 6,339 | 10,436 | 10,732 | 3,808 |
| Short-term liabilities | 17,373 | 3,587 | 2,468 | 8,230 |
| Equity and liabilities | 55,702 | 59,392 | 51,740 | 52,123 |
| 2020-06 | 2021-06 | 2022-06 | 2023-06 | |
|---|---|---|---|---|
| Non-current assets | 27,500 | 18,596 | 27,333 | 38,608 |
| Intangible assets | 347 | 231 | 265 | 305 |
| Tangible assets | 27,087 | 18,180 | 22,426 | 33,912 |
| Financial assets | 29 | 0 | 4,587 | 4,141 |
| Other non-current assets | 38 | 186 | 54 | 250 |
| Current assets | 12,440 | 38,547 | 30,693 | 14,966 |
| Inventories and prepaid expenses | 770 | 39 | 32 | 25 |
| Accounts receivable in one year | 3,682 | 8,716 | 1,325 | 2,022 |
| Other current assets | 0 | |||
| Cash and cash equivalents | 7,988 | 29,792 | 29,335 | 12,919 |
| Total assets | 39,940 | 57,143 | 58,026 | 53,574 |
| Equity | 31,287 | 42,929 | 45,641 | 37,681 |
| Grants and subsidies | 0 | 0 | 98 | 93 |
| Liabilities | 8,462 | 14,071 | 12,051 | 15,602 |
| Financial liabilities | 0 | 0 | 1,151 | 1,321 |
| Long-term liabilities | 6,241 | 9,979 | 10,581 | 10,703 |
| Short-term liabilities | 2,221 | 4,092 | 1,471 | 4,898 |
| Equity and liabilities | 39,940 | 57,143 | 58,026 | 53,574 |
Financial ratios
| 2020 | 2021 | 2022 | 2023 | |
|---|---|---|---|---|
| Capital return ratios | ||||
| Return on assets (ROA) | 0% | 21% | 2% | 3% |
| Return on equity (ROE) | 1% | 32% | 3% | 4% |
| Return on capital employed (ROCE) | 0% | 1% | 2% | 2% |
| Capital structure and liquidity ratios | ||||
| Debt / asset ratio (D/A) | 0.02 | 0.02 | 0.03 | 0.06 |
| Current Ratio | 1.57 | 10.36 | 7.09 | 0.47 |
| Quick ratio | 1.53 | 10.35 | 7.08 | 0.46 |
| Turnover ratios | ||||
| Asset turnover | 0.37 | 0.16 | 0.25 | 0.32 |
| Fixed asset turnover | 0.72 | 0.43 | 0.38 | 0.34 |
| Equity turnover | 0.64 | 0.21 | 0.34 | 0.41 |
| Profitability ratios | ||||
| EBITDA margin | 26% | 173% | 30% | 25% |
| Operating profit margin | 0% | 4% | 7% | 5% |
| Net profit margin | 1% | 128% | 8% | 9% |
| Other ratios | ||||
| Dividends to the State | 373.00 | 7,639.10 | 940.20 | 1,705.20 |
| Dividends paid / net profit | 1.78 | 0.62 | 0.86 | 1.09 |
| 2020-06 | 2021-06 | 2022-06 | 2023-06 | |
|---|---|---|---|---|
| Capital return ratios | ||||
| Return on assets (ROA) | 1% | 24% | 2% | 2% |
| Return on equity (ROE) | 1% | 31% | 3% | 3% |
| Return on capital employed (ROCE) | -0% | 1% | 1% | 0% |
| Capital structure and liquidity ratios | ||||
| Debt / asset ratio (D/A) | 0.00 | 0.00 | 0.02 | 0.02 |
| Current Ratio | 5.60 | 9.42 | 20.87 | 3.06 |
| Quick ratio | 5.26 | 9.41 | 20.85 | 3.05 |
| Turnover ratios | ||||
| Asset turnover | 0.25 | 0.08 | 0.10 | 0.15 |
| Fixed asset turnover | 0.36 | 0.24 | 0.21 | 0.20 |
| Equity turnover | 0.32 | 0.10 | 0.13 | 0.21 |
| Profitability ratios | ||||
| EBITDA margin | 26% | 353% | 31% | 19% |
| Operating profit margin | -0% | 6% | 9% | 3% |
| Net profit margin | 0% | 261% | 7% | 4% |
| Other ratios | ||||
| Dividends to the State | ||||
| Dividends paid / net profit |
Financial statments
Expectations of the state
About the company
- Official nameAB Lietuvos radijo ir televizijos centras
- Legal formPublic limited liability company (AB)
- Company code120505210
- SectorTransport and Communications
- Line of businessBroadcasting of radio and television, broadband internet services
- Institution representing the StateMinistry of Transport and Communications
- Share belonging to the State100%
Return to the State
1.7 EUR milion
ROE
4.0%
Number of employees
155
Financial data provided as at end-December 2023
Management
- Remigijus ŠerisChief Executive Officer
Information as of: 2024/07/01
Board of Directors
CHAIRMAN OF THE BOARD OF DIRECTORS
- Aušra PranckaitytėIndependent member; UAB Vidaus audito konsultacijos
MEMBERS OF THE BOARD OF DIRECTORS
- Roma AndruškevičienėMinistry of Transport and Communications
- Ramūnas Markauskas Independent member; UAB Nord Security
Information as of: 2024/07/01


