Valstybės investicijų valdymo agentūra

A company established by the Ministry of Finance to manage the Business Assistance Fund. The Fund provides financing for companies facing the challenges of the pandemic. By providing loans and investments to businesses through the redemption of their bonds, VIVA contributes to activating Lithuania’s financial and capital markets and stimulating the economy.
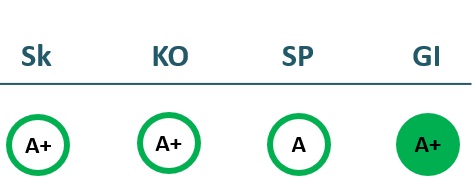
2021/22 GOOD CORPORATE GOVERNANCE INDEX
2020/21 GOOD CORPORATE GOVERNANCE INDEX
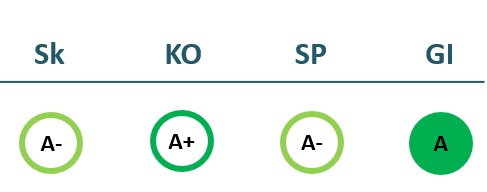
Sk – Transparency dimension
KO – Board dimension
SP – Strategic planning and target achievement dimension
GI – Good governance ratio
Financial results
P/L Statment
| 2021 | 2022 | 2023 | 2024 | |
|---|---|---|---|---|
| Revenue | 2,395 | 2,379 | ||
| Cost of goods sold | ||||
| Gross profit (loss) | 2,395 | 2,379 | 0 | 0 |
| Gross profit margin | 100% | 100% | % | % |
| Operating expenses | 1,968 | 1,997 | ||
| Operating profit (loss) | 22,851 | 9,583 | 148 | 3,101 |
| Operating profit margin | 18% | 16% | % | % |
| EBITDA | 511 | 480 | 0 | 0 |
| EBITDA margin | 21% | 20% | % | % |
| Net profit (loss) | 360 | 320 | 0 | 0 |
| Net profit margin | 15% | 13% | % | % |
| 2022-06 | 2023-06 | 2024-06 | 2025-06 | |
|---|---|---|---|---|
| Revenue | 1,500 | |||
| Cost of goods sold | ||||
| Gross profit (loss) | 1,500 | 0 | 0 | 0 |
| Gross profit margin | 100% | % | % | % |
| Operating expenses | 851 | |||
| Operating profit (loss) | 649 | 0 | 0 | 0 |
| Operating profit margin | 43% | % | % | % |
| EBITDA | 696 | 0 | 0 | 0 |
| EBITDA margin | 46% | % | % | % |
| Net profit (loss) | 647 | 0 | 0 | 0 |
| Net profit margin | 43% | % | % | % |
Balance sheet
| 2021 | 2022 | 2023 | 2024 | |
|---|---|---|---|---|
| Non-current assets | 178 | 104 | 0 | 0 |
| Intangible assets | 8 | 13 | ||
| Tangible assets | 34 | 20 | ||
| Financial assets | ||||
| Other non-current assets | 137 | 72 | ||
| Current assets | 1,709 | 1,904 | 0 | 0 |
| Inventories and prepaid expenses | 149 | |||
| Accounts receivable in one year | 1 | 1 | ||
| Other current assets | ||||
| Cash and cash equivalents | 1,708 | 1,754 | ||
| Total assets | 1,916 | 2,028 | 0 | 0 |
| Equity | 1,372 | 1,476 | 0 | 0 |
| Grants and subsidies | ||||
| Liabilities | 544 | 552 | 0 | 0 |
| Financial liabilities | 127 | 61 | 0 | 0 |
| Long-term liabilities | 153 | 48 | ||
| Short-term liabilities | 391 | 504 | ||
| Equity and liabilities | 1,916 | 2,028 | 0 | 0 |
| 2022-06 | 2023-06 | 2024-06 | 2025-06 | |
|---|---|---|---|---|
| Non-current assets | 139 | 0 | 0 | 0 |
| Intangible assets | 6 | |||
| Tangible assets | 27 | |||
| Financial assets | ||||
| Other non-current assets | 107 | |||
| Current assets | 1,929 | 0 | 0 | 0 |
| Inventories and prepaid expenses | ||||
| Accounts receivable in one year | 1 | |||
| Other current assets | ||||
| Cash and cash equivalents | 1,927 | |||
| Total assets | 2,113 | 0 | 0 | 0 |
| Equity | 1,803 | 0 | 0 | 0 |
| Grants and subsidies | ||||
| Liabilities | 310 | 0 | 0 | 0 |
| Financial liabilities | 95 | 0 | 0 | 0 |
| Long-term liabilities | 116 | |||
| Short-term liabilities | 194 | |||
| Equity and liabilities | 2,113 | 0 | 0 | 0 |
Financial ratios
| 2021 | 2022 | 2023 | 2024 | |
|---|---|---|---|---|
| Capital return ratios | ||||
| Return on assets (ROA) | 22% | 16% | 0% | % |
| Return on equity (ROE) | 30% | 22% | 0% | % |
| Return on capital employed (ROCE) | 28% | 25% | % | % |
| Capital structure and liquidity ratios | ||||
| Debt / asset ratio (D/A) | 0.07 | 0.03 | ||
| Current Ratio | 4.37 | 3.78 | ||
| Quick ratio | 4.37 | 3.49 | ||
| Turnover ratios | ||||
| Asset turnover | 1.25 | 1.17 | ||
| Fixed asset turnover | 13.44 | 22.80 | ||
| Equity turnover | 1.75 | 1.61 | ||
| Profitability ratios | ||||
| EBITDA margin | 21% | 20% | % | % |
| Operating profit margin | 18% | 16% | % | % |
| Net profit margin | 15% | 13% | % | % |
| Other ratios | ||||
| Dividends to the State | 216.10 | 375.90 | 0.00 | 0.00 |
| Dividends paid / net profit | 0.60 | 1.18 |
| 2022-06 | 2023-06 | |
|---|---|---|
| Capital return ratios | ||
| Return on assets (ROA) | 49% | -31% |
| Return on equity (ROE) | 58% | -36% |
| Return on capital employed (ROCE) | 34% | % |
| Capital structure and liquidity ratios | ||
| Debt / asset ratio (D/A) | 0.04 | |
| Current Ratio | 9.97 | |
| Quick ratio | 9.97 | |
| Turnover ratios | ||
| Asset turnover | 0.71 | |
| Fixed asset turnover | 10.76 | |
| Equity turnover | 0.83 | |
| Profitability ratios | ||
| EBITDA margin | 46% | % |
| Operating profit margin | 43% | % |
| Net profit margin | 43% | % |
| Other ratios | ||
| Dividends to the State | ||
| Dividends paid / net profit |
Expectations of the state
About the company
- Official nameUAB Valstybės investicijų valdymo agentūra
- Legal formPrivate limited liability company (UAB)
- Company code305612545
- SectorOther
- Line of businessBusiness support fund administration
- AccountabilityInvesticijų ir verslo garantijos
- Share indirectly belonging to the State100%
- Contacts https://viva.lt/
Return to the State
376 EUR thousand
ROE
22.5%
Number of employees
22
Financial data provided as at end-December 2024
Management
- L.. e. p. Liudas SinkevičiusActing Chief Executive Officer
The information is relevant


