Lietuvos paštas
Akcinė bendrovė Lietuvos paštas is the largest postal and parcel service provider in the country, delivering over 30 million parcels annually. We serve customers through nearly 170 post offices, around 440 mobile postal couriers, and more than 1,150 parcel lockers connecting the three Baltic countries. The company’s vision is to be the most reliable parcel delivery network connecting the region with the world.
2024/25 GOOD CORPORATE GOVERNANCE INDEX
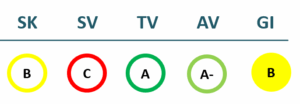
SK – Transparency Dimension
SV – Strategic Management Dimension
TV – Sustainability Dimension
AV – Shareholder Actions Dimension
GI – Good Governance Indicator
Financial results
P/L Statment
| 2022 | 2023 | 2024 | 2025 | |
|---|---|---|---|---|
| Revenue | 93,725 | 98,986 | 99,370 | 108,265 |
| Cost of goods sold | ||||
| Gross profit (loss) | 93,725 | 98,986 | 99,370 | 108,265 |
| Gross profit margin | 100% | 100% | 100% | 100% |
| Operating expenses | ||||
| Operating profit (loss) | -14,514 | -5,498 | -10,072 | -12,704 |
| Operating profit margin | -15% | -6% | -10% | -12% |
| EBITDA | 13,046 | 13,764 | 10,256 | 17,596 |
| EBITDA margin | 14% | 14% | 10% | 16% |
| Net profit (loss) | 4,838 | 5,152 | 242 | 5,944 |
| Net profit margin | 5% | 5% | 0% | 5% |
| 2022-06 | 2023-06 | 2024-06 | 2025-06 | |
|---|---|---|---|---|
| Revenue | 45,121 | 54,823 | 49,081 | 52,993 |
| Cost of goods sold | 0 | 0 | 0 | 0 |
| Gross profit (loss) | 45,121 | 54,823 | 49,081 | 52,993 |
| Gross profit margin | 100% | 100% | 100% | 100% |
| Operating expenses | 0 | 0 | 0 | 0 |
| Operating profit (loss) | -8,259 | 4,607 | -3,617 | -4,529 |
| Operating profit margin | -18% | 8% | -7% | -9% |
| EBITDA | -599 | 10,026 | 8,059 | 13,225 |
| EBITDA margin | -1% | 18% | 16% | 25% |
| Net profit (loss) | -4,173 | 5,332 | 2,335 | 6,340 |
| Net profit margin | -9% | 10% | 5% | 12% |
Balance sheet
| 2022 | 2023 | 2024 | 2025 | |
|---|---|---|---|---|
| Non-current assets | 56,937 | 60,054 | 62,840 | 67,832 |
| Intangible assets | 4,289 | 4,459 | 4,931 | 4,734 |
| Tangible assets | 38,984 | 38,176 | 35,796 | 38,097 |
| Financial assets | 71 | 79 | 0 | 0 |
| Other non-current assets | 56,937 | 60,054 | 62,840 | 67,832 |
| Current assets | 58,839 | 64,062 | 53,775 | 47,046 |
| Inventories and prepaid expenses | 3,323 | 3,693 | 597 | 551 |
| Accounts receivable in one year | 20,666 | 22,933 | 26,865 | 28,309 |
| Other current assets | 0 | 0 | 0 | |
| Cash and cash equivalents | 33,892 | 37,394 | 26,313 | 18,186 |
| Total assets | 121,883 | 130,093 | 117,438 | 115,900 |
| Equity | 32,089 | 37,240 | 34,414 | 38,191 |
| Grants and subsidies | 139 | 95 | 79 | 171 |
| Liabilities | 70,957 | 74,255 | 65,661 | 62,086 |
| Financial liabilities | 27,438 | 27,746 | 30,415 | 31,834 |
| Long-term liabilities | 21,390 | 21,631 | 23,510 | 24,755 |
| Short-term liabilities | 49,567 | 52,624 | 42,151 | 37,331 |
| Equity and liabilities | 121,883 | 130,093 | 117,438 | 115,900 |
| 2022-06 | 2023-06 | 2024-06 | 2025-06 | |
|---|---|---|---|---|
| Non-current assets | 58,118 | 58,401 | 63,366 | 60,663 |
| Intangible assets | 4,190 | 4,178 | 4,600 | 4,890 |
| Tangible assets | 40,742 | 37,605 | 37,181 | 34,704 |
| Financial assets | 78 | 11 | 0 | 0 |
| Other non-current assets | 13,108 | 16,607 | 21,585 | 21,069 |
| Current assets | 53,494 | 59,869 | 53,813 | 51,755 |
| Inventories and prepaid expenses | 1,990 | 3,285 | 3,724 | 3,336 |
| Accounts receivable in one year | 32,374 | 24,859 | 18,635 | 20,873 |
| Other current assets | 0 | 0 | 0 | 0 |
| Cash and cash equivalents | 19,130 | 30,868 | 31,453 | 27,404 |
| Total assets | 111,612 | 124,959 | 123,902 | 119,893 |
| Equity | 23,077 | 37,420 | 36,507 | 38,587 |
| Grants and subsidies | 188 | 105 | 86 | 72 |
| Liabilities | 62,806 | 66,982 | 67,531 | 63,286 |
| Financial liabilities | 26,939 | 29,291 | 30,979 | 28,207 |
| Long-term liabilities | 21,340 | 23,009 | 24,903 | 21,854 |
| Short-term liabilities | 41,466 | 43,974 | 42,628 | 41,432 |
| Equity and liabilities | 111,612 | 124,959 | 123,902 | 119,893 |
Financial ratios
| 2022 | 2023 | 2024 | 2025 | |
|---|---|---|---|---|
| Capital return ratios | ||||
| Return on assets (ROA) | 4% | 4% | 0% | 5% |
| Return on equity (ROE) | 16% | 15% | 1% | 16% |
| Return on capital employed (ROCE) | -27% | -9% | -17% | -20% |
| Capital structure and liquidity ratios | ||||
| Debt / asset ratio (D/A) | 0.23 | 0.21 | 0.26 | 0.27 |
| Current Ratio | 1.19 | 1.22 | 1.28 | 1.26 |
| Quick ratio | 1.12 | 1.15 | 1.26 | 1.25 |
| Turnover ratios | ||||
| Asset turnover | 0.77 | 0.76 | 0.85 | 0.93 |
| Fixed asset turnover | 1.65 | 1.65 | 1.58 | 1.60 |
| Equity turnover | 2.92 | 2.66 | 2.89 | 2.83 |
| Profitability ratios | ||||
| EBITDA margin | 14% | 14% | 10% | 16% |
| Operating profit margin | -15% | -6% | -10% | -12% |
| Net profit margin | 5% | 5% | 0% | 5% |
| Other ratios | ||||
| Dividends to the State | 0.00 | 3,067.90 | 2,167.00 | 791.50 |
| Dividends paid / net profit | 0.00 | 0.60 | 8.96 | 0.13 |
| 2022-06 | 2023-06 | 2024-06 | 2025-06 | |
|---|---|---|---|---|
| Capital return ratios | ||||
| Return on assets (ROA) | -10% | 12% | 2% | 3% |
| Return on equity (ROE) | -41% | 47% | 6% | 11% |
| Return on capital employed (ROCE) | -19% | 8% | -6% | -7% |
| Capital structure and liquidity ratios | ||||
| Debt / asset ratio (D/A) | 0.24 | 0.23 | 0.25 | 0.24 |
| Current Ratio | 1.29 | 1.36 | 1.26 | 1.25 |
| Quick ratio | 1.24 | 1.29 | 1.18 | 1.17 |
| Turnover ratios | ||||
| Asset turnover | 0.40 | 0.44 | 0.40 | 0.44 |
| Fixed asset turnover | 0.78 | 0.94 | 0.77 | 0.87 |
| Equity turnover | 1.96 | 1.47 | 1.34 | 1.37 |
| Profitability ratios | ||||
| EBITDA margin | -1% | 18% | 16% | 25% |
| Operating profit margin | -18% | 8% | -7% | -9% |
| Net profit margin | -9% | 10% | 5% | 12% |
| Other ratios | ||||
| Dividends to the State | ||||
| Dividends paid / net profit |
Financial statments
Expectations of the state
About the company
- Official nameAB Lietuvos pašto įmonių grupė
- Legal formPublic limited liability company (AB)
- Company code121215587
- SectorTransport and Communications
- Line of businessPostal services
- Institution representing the StateMinistry of Transport and Communications
- Special obligationsPerformes non-commercial special obligations
- Share belonging to the State100%
- Contacts http://www.post.lt/
Return to the State
792 EUR thousand
ROE
5.1%
Number of employees
2,563
Financial data provided as at end-December 2024
Management
- Kastytis ValantinasChief Executive officer
Term of office expires: 2030/05/12
The information is relevant
Board of Directors
CHAIRMAN OF THE BOARD OF DIRECTORS
- Jūratė StanišauskienėIndependent member
MEMBERS OF THE BOARD OF DIRECTORS
- Vaidotas DirmeikisIndependent member
- Liutauras VaranavičiusIndependent member
- Vytautas VorobjovasIndependent member
- Jonas BazysMinistry of Transport and Communications
Term of office expires: 2028/06/21
The information is relevant


