Investicijų ir verslo garantijos

UAB Investicijų ir verslo garantijos (INVEGA) is a national development institution established by the Government of the Republic of Lithuania to help Lithuanian businesses obtain the financing they need. INVEGA uses taxpayers’ money efficiently, assesses risks competently and focuses on business projectsthat create wealth for the whole country: its guarantees help to solve the problem of insufficient or unattractive collateral for financial institutions, administration and direct provision of soft loans, subsidies and venture capital instruments facilitate access to finance.
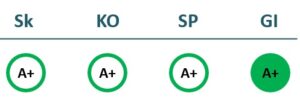
2022/23 GOOD CORPORATE GOVERNANCE INDEX
2021/22 GOOD CORPORATE GOVERNANCE INDEX
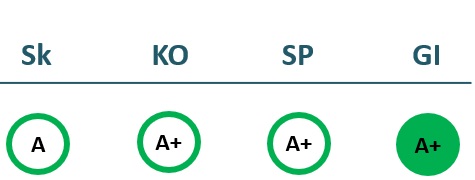
Sk – Transparency dimension
KO – Board dimension
SP – Strategic planning and target achievement dimension
GI – Good governance ratio
Financial results
P/L Statment
| 2020 | 2021 | 2022 | 2023 | |
|---|---|---|---|---|
| Revenue | 4,909 | 6,050 | 6,976 | 18,105 |
| Cost of goods sold | ||||
| Gross profit (loss) | 4,909 | 6,050 | 6,976 | 18,105 |
| Gross profit margin | 100% | 100% | 100% | 100% |
| Operating expenses | 4,124 | 5,182 | 6,103 | 15,407 |
| Operating profit (loss) | 420 | 952 | 959 | 8,622 |
| Operating profit margin | 9% | 16% | 14% | 48% |
| EBITDA | 611 | 1,184 | 1,254 | 9,334 |
| EBITDA margin | 12% | 20% | 18% | 52% |
| Net profit (loss) | 360 | 816 | 841 | 7,668 |
| Net profit margin | 7% | 13% | 12% | 42% |
| 2020-06 | 2021-06 | 2022-06 | 2023-06 | |
|---|---|---|---|---|
| Revenue | 2,238 | 2,878 | 3,486 | 8,668 |
| Cost of goods sold | 0 | 0 | 0 | 0 |
| Gross profit (loss) | 2,238 | 2,878 | 3,486 | 8,668 |
| Gross profit margin | 100% | 100% | 100% | 100% |
| Operating expenses | 1,748 | 2,392 | 2,968 | 7,283 |
| Operating profit (loss) | 273 | 901 | 521 | 3,947 |
| Operating profit margin | 12% | 31% | 15% | 46% |
| EBITDA | 365 | 1,003 | 658 | 4,406 |
| EBITDA margin | 16% | 35% | 19% | 51% |
| Net profit (loss) | 257 | 780 | 454 | 3,574 |
| Net profit margin | 11% | 27% | 13% | 41% |
Balance sheet
| 2020 | 2021 | 2022 | 2023 | |
|---|---|---|---|---|
| Non-current assets | 9,491 | 6,711 | 11,137 | 47,278 |
| Intangible assets | 21 | 18 | 39 | 761 |
| Tangible assets | 719 | 747 | 537 | 640 |
| Financial assets | 8,477 | 5,684 | 10,362 | 20,242 |
| Other non-current assets | 274 | 262 | 199 | 25,634 |
| Current assets | 24,914 | 22,219 | 17,678 | 43,813 |
| Inventories and prepaid expenses | 0 | 0 | 0 | |
| Accounts receivable in one year | 7,468 | 11,169 | 11,528 | 13,661 |
| Other current assets | 3,735 | 4,497 | 5,474 | 14,563 |
| Cash and cash equivalents | 13,710 | 6,554 | 676 | 15,589 |
| Total assets | 34,404 | 28,930 | 28,815 | 91,091 |
| Equity | 12,062 | 12,590 | 12,861 | 57,744 |
| Grants and subsidies | 10 | 0 | 128 | |
| Liabilities | 11,663 | 1,847 | 1,188 | 2,297 |
| Financial liabilities | 616 | 691 | 247 | 0 |
| Long-term liabilities | 555 | 622 | 354 | 315 |
| Short-term liabilities | 11,108 | 1,225 | 834 | 1,982 |
| Equity and liabilities | 34,404 | 28,930 | 28,815 | 91,091 |
| 2020-06 | 2021-06 | 2022-06 | 2023-06 | |
|---|---|---|---|---|
| Non-current assets | 10,719 | 7,999 | 11,973 | 50,799 |
| Intangible assets | 20 | 10 | 21 | 7,584 |
| Tangible assets | 781 | 640 | 622 | 1,076 |
| Financial assets | 9,629 | 7,139 | 11,111 | 22,534 |
| Other non-current assets | 289 | 209 | 219 | 19,605 |
| Current assets | 12,781 | 14,958 | 16,797 | 47,233 |
| Inventories and prepaid expenses | 0 | 0 | 0 | |
| Accounts receivable in one year | 5,989 | 7,876 | 12,527 | 14,597 |
| Other current assets | 3,837 | 2,685 | 3,216 | 22,635 |
| Cash and cash equivalents | 2,955 | 4,398 | 1,054 | 10,001 |
| Total assets | 23,500 | 22,957 | 28,770 | 98,032 |
| Equity | 11,960 | 12,555 | 12,473 | 56,863 |
| Grants and subsidies | 19 | 0 | 28 | |
| Liabilities | 4,399 | 2,882 | 1,197 | 2,883 |
| Financial liabilities | 0 | 538 | 577 | 481 |
| Long-term liabilities | 1,251 | 555 | 540 | 379 |
| Short-term liabilities | 3,148 | 2,327 | 658 | 2,503 |
| Equity and liabilities | 23,500 | 22,957 | 28,770 | 98,032 |
Financial ratios
| 2020 | 2021 | 2022 | 2023 | |
|---|---|---|---|---|
| Capital return ratios | ||||
| Return on assets (ROA) | 1% | 3% | 3% | 13% |
| Return on equity (ROE) | 3% | 7% | 7% | 22% |
| Return on capital employed (ROCE) | 3% | 7% | 7% | 15% |
| Capital structure and liquidity ratios | ||||
| Debt / asset ratio (D/A) | 0.02 | 0.02 | 0.02 | 0.01 |
| Current Ratio | 2.24 | 18.14 | 21.20 | 22.10 |
| Quick ratio | 2.24 | 18.14 | 21.20 | 22.10 |
| Turnover ratios | ||||
| Asset turnover | 0.14 | 0.21 | 0.24 | 0.20 |
| Fixed asset turnover | 0.52 | 0.90 | 0.63 | 0.38 |
| Equity turnover | 0.41 | 0.48 | 0.54 | 0.31 |
| Profitability ratios | ||||
| EBITDA margin | 12% | 20% | 18% | 52% |
| Operating profit margin | 9% | 16% | 14% | 48% |
| Net profit margin | 7% | 13% | 12% | 42% |
| Other ratios | ||||
| Dividends to the State | 287.66 | 570.89 | 631.00 | 573.20 |
| Dividends paid / net profit | 0.80 | 0.70 | 0.75 | 0.07 |
| 2020-06 | 2021-06 | 2022-06 | 2023-06 | |
|---|---|---|---|---|
| Capital return ratios | ||||
| Return on assets (ROA) | 2% | 4% | 2% | 6% |
| Return on equity (ROE) | 4% | 7% | 4% | 11% |
| Return on capital employed (ROCE) | 2% | 7% | 4% | 7% |
| Capital structure and liquidity ratios | ||||
| Debt / asset ratio (D/A) | 0.00 | 0.02 | 0.02 | 0.00 |
| Current Ratio | 4.06 | 6.43 | 25.54 | 18.87 |
| Quick ratio | 4.06 | 6.43 | 25.54 | 18.87 |
| Turnover ratios | ||||
| Asset turnover | 0.10 | 0.13 | 0.12 | 0.09 |
| Fixed asset turnover | 0.21 | 0.36 | 0.29 | 0.17 |
| Equity turnover | 0.19 | 0.23 | 0.28 | 0.15 |
| Profitability ratios | ||||
| EBITDA margin | 16% | 35% | 19% | 51% |
| Operating profit margin | 12% | 31% | 15% | 46% |
| Net profit margin | 11% | 27% | 13% | 41% |
| Other ratios | ||||
| Dividends to the State | ||||
| Dividends paid / net profit |
Financial statments
Expectations of the state
About the company
- Official nameUAB „Investicijų ir verslo garantijos“
- Legal formPrivate limited liability company (UAB)
- Company code110084026
- SectorOther
- Line of businessGrants to small and medium-size enterprises
- Institution representing the StateMinistry of Finance
- Special obligationsPerformes non-commercial special obligations
- Share belonging to the State100%
Return to the State
573 EUR thousand
ROE
21.7%
Number of employees
259
Financial data provided as at end-December 2023
Management
- Dainius VilčinskasChief Executive Officer
Information as of: 2024/06/03
Board of Directors
CHAIRMAN OF THE BOARD OF DIRECTORS
- Dainius VilčinskasUAB Investicijų ir verslo garantijos
MEMBERS OF THE BOARD OF DIRECTORS
- Inga BeiliūnienėUAB Investicijų ir verslo garantijos
- Lina StragauskienėUAB Investicijų ir verslo garantijos
- Jonas KanapeckasUAB Investicijų ir verslo garantijos
- Giedrė GečiauskienėUAB Investicijų ir verslo garantijos; UAB Būsto paskolų draudimas
Information as of: 2024/06/03
Supervisory board
CHAIRMAN OF THE SUPERVISORY BOARD
- Daina KleponėIndependent member; Vilnius Gediminas Technical University
SUPERVISORY BOARD MEMBERS
- Aivaras ČičelisIndependent member; BMI Executive Institute, VšĮ; UAB Švaros broliai; PRO BRO Car Wash Systems, UAB; PRO BRO Group, UAB; AB HISK
- Saulius GalatiltisIndependent member; UAB Foxpay
- Povilas KriaučeliūnasMinistry of the Economy and Innovation
- Pascal LagardeIndependent member; Bifrance; European Investment Fund (EIF)
- Aurimas SaladžiusMinistry of Environment; VĮ Valstybinių miškų urėdija
- Irma PatapienėMinistry of Finance
Information as of: 2024/06/03