Turto bankas
In 1996, Aurabank was reorganised into a non-performing asset management company AB Turto bankas, which was transformed into a state-owned enterprise in February 2011. On 1 October 2014, the state enterprise Turto bankas was reorganised by attaching the state’s company Valstybės turto fondas. As of June 1, 2026, Turto bankas was transformed from a state-owned enterprise into a public limited liability company. The main areas of activity of the bank are: centralised state property management, privatization of shares owned by the state and municipalities, recovery of debts and loans to the state , state guarantees and other liabilities execution.
2024/25 GOOD CORPORATE GOVERNANCE INDEX
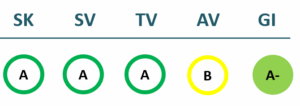
SK – Transparency Dimension
SV – Strategic Management Dimension
TV – Sustainability Dimension
AV – Shareholder Actions Dimension
GI – Good Governance Indicator
Financial results
P/L Statment
| 2022 | 2023 | 2024 | 2025 | |
|---|---|---|---|---|
| Revenue | 30,939 | 33,353 | 41,350 | 41,552 |
| Cost of goods sold | 19,957 | 23,081 | 22,676 | 21,569 |
| Gross profit (loss) | 10,982 | 10,272 | 18,674 | 19,983 |
| Gross profit margin | 35% | 31% | 45% | 48% |
| Operating expenses | 10,530 | 8,938 | 12,298 | 16,004 |
| Operating profit (loss) | 452 | 1,335 | 6,376 | 3,979 |
| Operating profit margin | 1% | 4% | 15% | 10% |
| EBITDA | 5,560 | 7,055 | 15,763 | 13,329 |
| EBITDA margin | 18% | 21% | 38% | 32% |
| Net profit (loss) | 156 | 429 | 5,315 | 1,136 |
| Net profit margin | 1% | 1% | 13% | 3% |
| 2022-06 | 2023-06 | 2024-06 | 2025-06 | |
|---|---|---|---|---|
| Revenue | 12,203 | 13,449 | 14,765 | 17,424 |
| Cost of goods sold | 8,833 | 11,490 | 13,153 | 9,990 |
| Gross profit (loss) | 3,369 | 1,959 | 1,612 | 7,434 |
| Gross profit margin | 28% | 15% | 11% | 43% |
| Operating expenses | 3,317 | 6,934 | 0 | 0 |
| Operating profit (loss) | 52 | -4,975 | -3,280 | 770 |
| Operating profit margin | 0% | -37% | -22% | 4% |
| EBITDA | 2,607 | -2,291 | 2,099 | 5,677 |
| EBITDA margin | 21% | -17% | 14% | 33% |
| Net profit (loss) | 133 | -4,888 | -3,701 | 445 |
| Net profit margin | 1% | -36% | -25% | 3% |
Balance sheet
| 2022 | 2023 | 2024 | 2025 | |
|---|---|---|---|---|
| Non-current assets | 352,698 | 390,521 | 618,737 | 634,716 |
| Intangible assets | 334 | 167 | 63 | 17 |
| Tangible assets | 350,989 | 390,348 | 618,674 | 634,699 |
| Financial assets | 1,369 | |||
| Other non-current assets | 352,698 | 390,521 | 618,737 | 634,716 |
| Current assets | 138,803 | 152,021 | 86,955 | 92,939 |
| Inventories and prepaid expenses | 62,114 | 68,812 | 5,851 | 4,546 |
| Accounts receivable in one year | 9,187 | 3,369 | 4,198 | 3,518 |
| Other current assets | 0 | 0 | 53,822 | |
| Cash and cash equivalents | 67,502 | 79,841 | 76,906 | 31,053 |
| Total assets | 492,554 | 543,486 | 706,463 | 728,131 |
| Equity | 352,707 | 361,740 | 561,468 | 561,478 |
| Grants and subsidies | 11,668 | 13,198 | 22,810 | 23,708 |
| Liabilities | 128,072 | 167,534 | 84,043 | 102,670 |
| Financial liabilities | 5,276 | 29,914 | 30,165 | 52,377 |
| Long-term liabilities | 63,956 | 104,638 | 62,262 | 77,823 |
| Short-term liabilities | 64,116 | 62,897 | 21,781 | 24,847 |
| Equity and liabilities | 492,554 | 543,486 | 706,463 | 728,131 |
| 2022-06 | 2023-06 | 2024-06 | 2025-06 | |
|---|---|---|---|---|
| Non-current assets | 353,150 | 365,671 | 399,005 | 665,017 |
| Intangible assets | 305 | 250 | 94 | 38 |
| Tangible assets | 350,301 | 365,414 | 398,904 | 664,979 |
| Financial assets | 2,539 | 1 | 0 | 0 |
| Other non-current assets | 5 | 7 | 7 | 0 |
| Current assets | 127,066 | 126,569 | 140,611 | 75,679 |
| Inventories and prepaid expenses | 55,461 | 68,658 | 65,792 | 201 |
| Accounts receivable in one year | 7,486 | 5,491 | 6,213 | 6,394 |
| Other current assets | 0 | 0 | 38,322 | |
| Cash and cash equivalents | 64,119 | 52,421 | 68,606 | 30,762 |
| Total assets | 480,742 | 493,416 | 546,957 | 741,839 |
| Equity | 350,290 | 350,285 | 364,620 | 633,011 |
| Grants and subsidies | 11,061 | 11,610 | 15,695 | 17,376 |
| Liabilities | 119,073 | 131,170 | 164,034 | 87,458 |
| Financial liabilities | 2,348 | 7,348 | 35,573 | 31,920 |
| Long-term liabilities | 65,476 | 61,848 | 107,898 | 66,990 |
| Short-term liabilities | 53,597 | 69,323 | 56,136 | 20,468 |
| Equity and liabilities | 480,742 | 493,416 | 546,957 | 741,839 |
Financial ratios
| 2022 | 2023 | 2024 | 2025 | |
|---|---|---|---|---|
| Capital return ratios | ||||
| Return on assets (ROA) | 0% | 0% | 1% | 0% |
| Return on equity (ROE) | 0% | 0% | 1% | 0% |
| Return on capital employed (ROCE) | 0% | 0% | 1% | 1% |
| Capital structure and liquidity ratios | ||||
| Debt / asset ratio (D/A) | 0.01 | 0.06 | 0.04 | 0.07 |
| Current Ratio | 2.16 | 2.42 | 3.99 | 3.74 |
| Quick ratio | 1.20 | 1.32 | 3.72 | 3.56 |
| Turnover ratios | ||||
| Asset turnover | 0.06 | 0.06 | 0.06 | 0.06 |
| Fixed asset turnover | 0.09 | 0.09 | 0.07 | 0.07 |
| Equity turnover | 0.09 | 0.09 | 0.07 | 0.07 |
| Profitability ratios | ||||
| EBITDA margin | 18% | 21% | 38% | 32% |
| Operating profit margin | 1% | 4% | 15% | 10% |
| Net profit margin | 0% | 1% | 13% | 3% |
| Other ratios | ||||
| Dividends to the State | 438.90 | 329.00 | 4,733.00 | 710.00 |
| Dividends paid / net profit | 2.81 | 0.77 | 0.89 | 0.63 |
| 2022-06 | 2023-06 | 2024-06 | 2025-06 | |
|---|---|---|---|---|
| Capital return ratios | ||||
| Return on assets (ROA) | 0% | -1% | 0% | 2% |
| Return on equity (ROE) | 0% | -1% | 0% | 2% |
| Return on capital employed (ROCE) | 0% | -1% | -1% | 0% |
| Capital structure and liquidity ratios | ||||
| Debt / asset ratio (D/A) | 0.00 | 0.01 | 0.07 | 0.05 |
| Current Ratio | 2.37 | 1.83 | 2.50 | 3.70 |
| Quick ratio | 1.34 | 0.84 | 1.33 | 3.69 |
| Turnover ratios | ||||
| Asset turnover | 0.03 | 0.03 | 0.03 | 0.02 |
| Fixed asset turnover | 0.03 | 0.04 | 0.04 | 0.03 |
| Equity turnover | 0.03 | 0.04 | 0.04 | 0.03 |
| Profitability ratios | ||||
| EBITDA margin | 21% | -17% | 14% | 33% |
| Operating profit margin | 0% | -37% | -22% | 4% |
| Net profit margin | 1% | -36% | -25% | 3% |
| Other ratios | ||||
| Dividends to the State | ||||
| Dividends paid / net profit |
Financial statments
Expectations of the state
About the company
- Official nameAB Turto bankas
- Legal formPublic limited liability company (AB)
- Company code112021042
- SectorOther
- Line of businessManagement of State-owned real estate and recovery of debts to the State
- Institution representing the StateMinistry of Finance
- Special obligationsPerformes non-commercial special obligations
- Share belonging to the State100%
- Contacts http://www.turtas.lt
Return to the State
710 EUR thousand
ROE
0.2%
Number of employees
249
Financial data provided as at end-December 2024
Management
- L.e.p. Gintaras MakšimasActing Chief Executive officer
The information is relevant
Board of Directors
CHAIRMAN OF THE BOARD OF DIRECTORS
- -
MEMBERS OF THE BOARD OF DIRECTORS
- Ginataras MakšimasAB Turto bankas Acting Chief Executive officer
- Mindaugas LiutkusAB Turto bankas
- Laima KalinauskienėMinistry of Finance
- Ramūnas NarbutasAB Turto bankas
The information is relevant
Supervisory board
CHAIRMAN OF THE SUPERVISORY BOARD
- Rytis ValūnasIndependent member
SUPERVISORY BOARD MEMBERS
- Aurimas Tomas StaškevičiusIndependent member
- Žanas NeimantasIndependent member
- Vaida DumčiūtėMinistry of Finance
- Lina FrejutėMinistry of Finance
Term of office expires: 2030/07/01
The information is relevant


