Mūsų amatai

The State Enterprise Mūsų amatai was established in June 2014. The State Enterprise at Alytus Correctional Home, the State Enterprise at Marijampolė Correctional Home and the State Enterprise at Pravieniškės Correctional Home have been reorganised and merged into a single company in order to improve the efficiency of the company’s management and the quality of products. The main objective of the State Enterprise “Mūsų amatai” is to employ and train convicts, to provide them with vocational skills, to prepare them for work after their release, and to ensure the employment of convicted persons and their effective work, which is aimed at preparing them for their integration into the society and teaching them to pursue their goals in life by lawful ways and means. Main activities:
– Manufacture of office furniture (for private companies, institutions and organisations);
– Manufacture of furniture for educational institutions (kindergartens, schools, universities, libraries);
– Manufacture of upholstered furniture and chairs;
– Manufacture of furniture for the home (indoor and outdoor furniture)
– Manufacture of metal furniture (for industry, special service companies);
– Manufacture of metal storage furniture;
– Manufacture of medical furniture (for hospitals, clinics, nursing homes);
– Manufacture of metal products (for construction and furniture companies, home, leisure);
– Casting of cast iron products (for communication companies, home);
– Sewing services and products;
– Wood processing and manufacture of various wood products;
– Design and manufacture of non-standard products;
– Weaving of nets, wickerwork and other services.
2021/22 GOOD CORPORATE GOVERNANCE INDEX

2020/21 GOOD CORPORATE GOVERNANCE INDEX
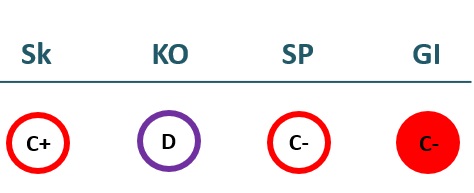
Sk – Transparency dimension
KO – Board dimension
SP – Strategic planning and target achievement dimension
GI – Good governance ratio
Financial results
P/L Statment
| 2021 | 2022 | 2023 | 2024 | |
|---|---|---|---|---|
| Revenue | 3,158 | |||
| Cost of goods sold | 3,125 | |||
| Gross profit (loss) | 33 | 0 | 0 | 0 |
| Gross profit margin | 1% | % | % | % |
| Operating expenses | 842 | |||
| Operating profit (loss) | -130 | 0 | 0 | 0 |
| Operating profit margin | -26% | % | % | % |
| EBITDA | -610 | 0 | 0 | 0 |
| EBITDA margin | -19% | % | % | % |
| Net profit (loss) | -822 | 0 | 0 | 0 |
| Net profit margin | -26% | % | % | % |
| 2022-06 | 2023-06 | 2024-06 | 2025-06 | |
|---|---|---|---|---|
| Revenue | 1,747 | |||
| Cost of goods sold | 1,641 | |||
| Gross profit (loss) | 106 | 0 | 0 | 0 |
| Gross profit margin | 6% | % | % | % |
| Operating expenses | 422 | |||
| Operating profit (loss) | -317 | 0 | 0 | 0 |
| Operating profit margin | -18% | % | % | % |
| EBITDA | -217 | 0 | 0 | 0 |
| EBITDA margin | -12% | % | % | % |
| Net profit (loss) | -318 | 0 | 0 | 0 |
| Net profit margin | -18% | % | % | % |
Balance sheet
| 2021 | 2022 | 2023 | 2024 | |
|---|---|---|---|---|
| Non-current assets | 2,939 | 0 | 0 | 0 |
| Intangible assets | 9 | |||
| Tangible assets | 2,930 | |||
| Financial assets | ||||
| Other non-current assets | ||||
| Current assets | 1,331 | 0 | 0 | 0 |
| Inventories and prepaid expenses | 991 | |||
| Accounts receivable in one year | 332 | |||
| Other current assets | ||||
| Cash and cash equivalents | 9 | |||
| Total assets | 4,270 | 0 | 0 | 0 |
| Equity | 2,690 | 0 | 0 | 0 |
| Grants and subsidies | ||||
| Liabilities | 1,580 | 0 | 0 | 0 |
| Financial liabilities | 0 | 0 | 0 | 0 |
| Long-term liabilities | 536 | |||
| Short-term liabilities | 1,045 | |||
| Equity and liabilities | 4,270 | 0 | 0 | 0 |
| 2022-06 | 2023-06 | 2024-06 | 2025-06 | |
|---|---|---|---|---|
| Non-current assets | 2,837 | 0 | 0 | 0 |
| Intangible assets | 7 | |||
| Tangible assets | 2,830 | |||
| Financial assets | ||||
| Other non-current assets | ||||
| Current assets | 1,082 | 0 | 0 | 0 |
| Inventories and prepaid expenses | 721 | |||
| Accounts receivable in one year | 341 | |||
| Other current assets | ||||
| Cash and cash equivalents | 20 | |||
| Total assets | 3,919 | 0 | 0 | 0 |
| Equity | 2,371 | 0 | 0 | 0 |
| Grants and subsidies | ||||
| Liabilities | 1,548 | 0 | 0 | 0 |
| Financial liabilities | 251 | 0 | 0 | 0 |
| Long-term liabilities | 456 | |||
| Short-term liabilities | 1,092 | |||
| Equity and liabilities | 3,919 | 0 | 0 | 0 |
Financial ratios
| 2021 | 2022 | 2023 | 2024 | |
|---|---|---|---|---|
| Capital return ratios | ||||
| Return on assets (ROA) | -18% | 0% | % | % |
| Return on equity (ROE) | -26% | 0% | % | % |
| Return on capital employed (ROCE) | -25% | % | % | % |
| Capital structure and liquidity ratios | ||||
| Debt / asset ratio (D/A) | 0.00 | |||
| Current Ratio | 1.27 | |||
| Quick ratio | 0.33 | |||
| Turnover ratios | ||||
| Asset turnover | 0.74 | |||
| Fixed asset turnover | 1.07 | |||
| Equity turnover | 1.17 | |||
| Profitability ratios | ||||
| EBITDA margin | -19% | % | % | % |
| Operating profit margin | -26% | % | % | % |
| Net profit margin | -26% | % | % | % |
| Other ratios | ||||
| Dividends to the State | 0.00 | 0.00 | 0.00 | 0.00 |
| Dividends paid / net profit | 0.00 |
| 2022-06 | 2023-06 | |
|---|---|---|
| Capital return ratios | ||
| Return on assets (ROA) | -17% | 16% |
| Return on equity (ROE) | -26% | 27% |
| Return on capital employed (ROCE) | -11% | % |
| Capital structure and liquidity ratios | ||
| Debt / asset ratio (D/A) | 0.06 | |
| Current Ratio | 0.99 | |
| Quick ratio | 0.33 | |
| Turnover ratios | ||
| Asset turnover | 0.45 | |
| Fixed asset turnover | 0.62 | |
| Equity turnover | 0.74 | |
| Profitability ratios | ||
| EBITDA margin | -12% | % |
| Operating profit margin | -18% | % |
| Net profit margin | -18% | % |
| Other ratios | ||
| Dividends to the State | ||
| Dividends paid / net profit |
Expectations of the state
About the company
- Official nameMūsų amatai, VĮ
- Legal formState enterprise (VĮ)
- Company code303316138
- SectorOther
- Line of businessProduction of clothing, electrical equipment, plastics, furniture, metalworks
- Accountability
- Special obligationsPerformes non-commercial special obligations
- Share indirectly belonging to the State0%
- Contacts http://www.musuamatai.com/
ROE
0.0%
Financial data provided as at end-December 2024


