Kelių priežiūra
AB Kelių priežiūra is a modernising company with ambitious goals. Combining decades of expertise and an innovative approach, the company has become one of the largest teams in Lithuania with over 2,200 employees.
The company is responsible for the maintenance of 21,000 kilometres of national roads. In winter, it ensures that roads are passable, and in spring and autumn it improves the quality of the roads by renewing worn-out road surfaces, profiling gravel roads, maintaining roadside structures and plantations, etc.
2024/25 GOOD CORPORATE GOVERNANCE INDEX
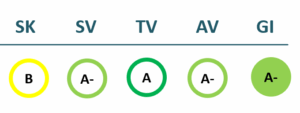
SK – Transparency Dimension
SV – Strategic Management Dimension
TV – Sustainability Dimension
AV – Shareholder Actions Dimension
GI – Good Governance Indicator
Financial results
P/L Statment
| 2022 | 2023 | 2024 | 2025 | |
|---|---|---|---|---|
| Revenue | 113,580 | 125,720 | 135,778 | 141,267 |
| Cost of goods sold | 109,627 | 113,240 | 117,013 | 124,127 |
| Gross profit (loss) | 3,953 | 12,480 | 18,766 | 17,140 |
| Gross profit margin | 3% | 10% | 14% | 12% |
| Operating expenses | 8,527 | 9,912 | 11,148 | 11,455 |
| Operating profit (loss) | -4,574 | 2,568 | 7,618 | 5,685 |
| Operating profit margin | -4% | 2% | 6% | 4% |
| EBITDA | 7,366 | 16,457 | 20,844 | 18,505 |
| EBITDA margin | 6% | 13% | 15% | 13% |
| Net profit (loss) | -3,918 | 4,487 | 6,962 | 5,691 |
| Net profit margin | -3% | 4% | 5% | 4% |
| 2022-06 | 2023-06 | 2024-06 | 2025-06 | |
|---|---|---|---|---|
| Revenue | 47,672 | 60,470 | 65,536 | 61,456 |
| Cost of goods sold | 46,663 | 53,811 | 58,272 | 53,814 |
| Gross profit (loss) | 1,009 | 6,659 | 7,264 | 7,642 |
| Gross profit margin | 2% | 11% | 11% | 12% |
| Operating expenses | 4,026 | 4,608 | 5,363 | 5,853 |
| Operating profit (loss) | -3,018 | 2,051 | 1,901 | 1,789 |
| Operating profit margin | -6% | 3% | 3% | 3% |
| EBITDA | 2,674 | 8,276 | 8,912 | 8,372 |
| EBITDA margin | 6% | 14% | 14% | 14% |
| Net profit (loss) | -2,467 | 2,517 | 2,629 | 973 |
| Net profit margin | -5% | 4% | 4% | 2% |
Balance sheet
| 2022 | 2023 | 2024 | 2025 | |
|---|---|---|---|---|
| Non-current assets | 100,292 | 104,579 | 102,649 | 108,444 |
| Intangible assets | 396 | 604 | 637 | 1,021 |
| Tangible assets | 95,742 | 100,202 | 97,889 | 101,648 |
| Financial assets | 0 | 0 | ||
| Other non-current assets | 100,292 | 104,579 | 102,649 | 108,444 |
| Current assets | 59,055 | 47,168 | 55,715 | 61,548 |
| Inventories and prepaid expenses | 10,391 | 9,548 | 10,471 | 9,367 |
| Accounts receivable in one year | 3,098 | 4,412 | 12,613 | 7,429 |
| Other current assets | 1,933 | 1,229 | 1,148 | 2,107 |
| Cash and cash equivalents | 43,633 | 31,979 | 31,484 | 42,644 |
| Total assets | 159,347 | 151,747 | 158,364 | 169,992 |
| Equity | 102,842 | 107,329 | 114,291 | 116,857 |
| Grants and subsidies | 11 | 59 | 88 | 113 |
| Liabilities | 53,294 | 41,315 | 41,017 | 49,577 |
| Financial liabilities | 7,595 | 16,255 | 18,209 | 20,193 |
| Long-term liabilities | 6,759 | 13,437 | 13,000 | 14,834 |
| Short-term liabilities | 46,535 | 27,878 | 28,018 | 34,743 |
| Equity and liabilities | 159,347 | 151,747 | 158,364 | 169,992 |
| 2022-06 | 2023-06 | 2024-06 | 2025-06 | |
|---|---|---|---|---|
| Non-current assets | 100,294 | 98,232 | 104,498 | 100,256 |
| Intangible assets | 198 | 345 | 539 | 650 |
| Tangible assets | 95,776 | 94,090 | 98,911 | 96,043 |
| Financial assets | 60 | 0 | 0 | 0 |
| Other non-current assets | 4,260 | 3,797 | 5,048 | 3,563 |
| Current assets | 34,135 | 38,340 | 56,128 | 54,331 |
| Inventories and prepaid expenses | 9,727 | 8,671 | 9,366 | 10,678 |
| Accounts receivable in one year | 15,223 | 15,103 | 18,666 | 15,840 |
| Other current assets | 4,053 | 3,258 | 784 | 960 |
| Cash and cash equivalents | 5,133 | 11,309 | 27,312 | 26,853 |
| Total assets | 134,429 | 136,573 | 160,626 | 154,587 |
| Equity | 104,294 | 105,359 | 109,958 | 112,139 |
| Grants and subsidies | 11 | 10 | 81 | 122 |
| Liabilities | 27,650 | 28,190 | 47,441 | 39,322 |
| Financial liabilities | 7,926 | 8,475 | 27,668 | 20,279 |
| Long-term liabilities | 8,315 | 6,836 | 26,571 | 17,901 |
| Short-term liabilities | 19,335 | 21,354 | 20,870 | 21,421 |
| Equity and liabilities | 134,429 | 136,573 | 160,626 | 154,587 |
Financial ratios
| 2022 | 2023 | 2024 | 2025 | |
|---|---|---|---|---|
| Capital return ratios | ||||
| Return on assets (ROA) | -3% | 3% | 4% | 3% |
| Return on equity (ROE) | -4% | 4% | 6% | 5% |
| Return on capital employed (ROCE) | -4% | 2% | 6% | 4% |
| Capital structure and liquidity ratios | ||||
| Debt / asset ratio (D/A) | 0.05 | 0.11 | 0.11 | 0.12 |
| Current Ratio | 1.27 | 1.69 | 1.99 | 1.77 |
| Quick ratio | 1.05 | 1.35 | 1.61 | 1.50 |
| Turnover ratios | ||||
| Asset turnover | 0.71 | 0.83 | 0.86 | 0.83 |
| Fixed asset turnover | 1.13 | 1.20 | 1.32 | 1.30 |
| Equity turnover | 1.10 | 1.17 | 1.19 | 1.21 |
| Profitability ratios | ||||
| EBITDA margin | 6% | 13% | 15% | 13% |
| Operating profit margin | -4% | 2% | 6% | 4% |
| Net profit margin | -3% | 4% | 5% | 4% |
| Other ratios | ||||
| Dividends to the State | 0.00 | 0.00 | 3,125.40 | 4,268.53 |
| Dividends paid / net profit | 0.00 | 0.00 | 0.45 | 0.75 |
| 2022-06 | 2023-06 | 2024-06 | 2025-06 | |
|---|---|---|---|---|
| Capital return ratios | ||||
| Return on assets (ROA) | -4% | 1% | 3% | 3% |
| Return on equity (ROE) | -5% | 1% | 4% | 5% |
| Return on capital employed (ROCE) | -3% | 2% | 1% | 1% |
| Capital structure and liquidity ratios | ||||
| Debt / asset ratio (D/A) | 0.06 | 0.06 | 0.17 | 0.13 |
| Current Ratio | 1.77 | 1.80 | 2.69 | 2.54 |
| Quick ratio | 1.26 | 1.39 | 2.24 | 2.04 |
| Turnover ratios | ||||
| Asset turnover | 0.35 | 0.44 | 0.41 | 0.40 |
| Fixed asset turnover | 0.48 | 0.62 | 0.63 | 0.61 |
| Equity turnover | 0.46 | 0.57 | 0.60 | 0.55 |
| Profitability ratios | ||||
| EBITDA margin | 6% | 14% | 14% | 14% |
| Operating profit margin | -6% | 3% | 3% | 3% |
| Net profit margin | -5% | 4% | 4% | 2% |
| Other ratios | ||||
| Dividends to the State | ||||
| Dividends paid / net profit |
Financial statments
Expectations of the state
About the company
- Official nameAB „Kelių priežiūra“
- Legal formPublic limited liability company (AB)
- Company code232112130
- SectorTransport and Communications
- Line of businessRoad construction and maintenance
- Institution representing the StateMinistry of Transport and Communications
- Special obligationsPerformes non-commercial special obligations
- Share belonging to the State100%
- Contacts http://keliuprieziura.lt/
Return to the State
4.3 EUR milion
ROE
3.5%
Number of employees
2,163
Financial data provided as at end-December 2024
Management
- Audrius VaitkusChief Executive officer
Term of office expires: 2029/01/08
The information is relevant
Board of Directors
CHAIRMAN OF THE BOARD OF DIRECTORS
- Julija Abromavičienė Independent member
MEMBERS OF THE BOARD OF DIRECTORS
- Jonas DavidavičiusIndependent member
- Tomas TumėnasIndependent member
- Dalia AndrulionienėIndependent member
- Jūratė BogdevičienėMinistry of Transport and Communications
Term of office expires: 2030/05/27
The information is relevant


