EPSO-G
“EPSO-G” is a 100% state-owned new energy group. The rights and obligations of the sole shareholder of the management company EPSO-G are exercised by the Ministry of Energy of the Republic of Lithuania.
The core activity of the EPSO-G Group is to ensure continuous and reliable electricity transmission through high-voltage networks and gas transportation via high-pressure pipelines. The Group is responsible for the efficient management, maintenance, contracting, and development of these transmission systems. The Group also operates 200 MW battery energy storage systems, which ensure the operation of the electricity system in isolated mode and provide balancing services.
Companies belonging to the Group manage and develop biofuel and timber trading platforms designed to ensure transparent competition in energy resource and roundwood markets. In addition, Group companies implement electricity infrastructure construction projects and provide infrastructure operation services to low-, medium-, and high-voltage network operators.
In cooperation with partners, the EPSO-G Group also invests in the development of Lithuania’s defense industry, which is of strategic importance to the State.
All EPSO-G Group companies are obliged to efficiently and timely implement the state-significant energy transmission and interconnection infrastructure projects set out in the shareholder’s letter of expectations, contributing to the objectives of the National Energy Independence Strategy and creating sustainable long-term value for the State of Lithuania, its people, and the national economy.
The EPSO-G Group consists of the management company EPSO-G and six directly controlled subsidiaries: Amber Grid, Baltpool, Energy Cells, EPSO-G Invest, Litgrid, and Tetas. EPSO-G and its group companies also hold shares in Rheinmetall Defence Lietuva, Baltic RCC OÜ, and TSO Holding AS.
2024/25 GOOD CORPORATE GOVERNANCE INDEX
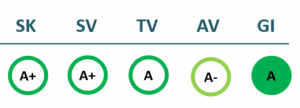
SK – Transparency Dimension
SV – Strategic Management Dimension
TV – Sustainability Dimension
AV – Shareholder Actions Dimension
GI – Good Governance Indicator
Financial results
P/L Statment
| 2022 | 2023 | 2024 | 2025 | |
|---|---|---|---|---|
| Revenue | 589,924 | 478,887 | 480,888 | 532,523 |
| Cost of goods sold | 459,940 | 274,419 | 281,480 | 338,986 |
| Gross profit (loss) | 129,984 | 204,468 | 199,408 | 193,537 |
| Gross profit margin | 22% | 43% | 41% | 36% |
| Operating expenses | 176,685 | 167,589 | 150,475 | 165,714 |
| Operating profit (loss) | -46,701 | 36,879 | 48,933 | 27,823 |
| Operating profit margin | -8% | 8% | 10% | 5% |
| EBITDA | -11,602 | 87,815 | 94,305 | 76,695 |
| EBITDA margin | -2% | 18% | 20% | 14% |
| Net profit (loss) | -42,515 | 53,801 | 54,887 | 37,775 |
| Net profit margin | -7% | 11% | 11% | 7% |
| 2022-06 | 2023-06 | 2024-06 | 2025-06 | |
|---|---|---|---|---|
| Revenue | 230,218 | 221,073 | 246,414 | 257,565 |
| Cost of goods sold | 234,321 | 185,649 | 213,902 | 307,423 |
| Gross profit (loss) | -4,103 | 35,424 | 32,512 | -49,858 |
| Gross profit margin | -2% | 16% | 13% | -19% |
| Operating expenses | ||||
| Operating profit (loss) | -4,103 | 35,424 | 32,512 | -49,858 |
| Operating profit margin | -2% | 16% | 13% | -19% |
| EBITDA | 13,453 | 52,526 | 56,796 | -25,106 |
| EBITDA margin | 6% | 24% | 23% | -10% |
| Net profit (loss) | -4,514 | 31,463 | 30,352 | -41,312 |
| Net profit margin | -2% | 14% | 12% | -16% |
Balance sheet
| 2022 | 2023 | 2024 | 2025 | |
|---|---|---|---|---|
| Non-current assets | 706,479 | 756,172 | 802,672 | 960,863 |
| Intangible assets | 8,422 | 8,175 | 6,886 | 7,907 |
| Tangible assets | 655,721 | 707,229 | 745,846 | 829,296 |
| Financial assets | 13,960 | 17,853 | 20,294 | 88,831 |
| Other non-current assets | 706,479 | 756,172 | 802,672 | 960,863 |
| Current assets | 719,249 | 322,285 | 405,108 | 287,400 |
| Inventories and prepaid expenses | 16,211 | 7,556 | 6,942 | 5,920 |
| Accounts receivable in one year | 196,500 | 175,595 | 141,045 | 154,459 |
| Other current assets | 54,664 | 15,898 | 155,559 | 75,728 |
| Cash and cash equivalents | 248,096 | 123,236 | 101,562 | 51,293 |
| Total assets | 1,425,728 | 1,078,457 | 1,207,780 | 1,248,263 |
| Equity | 227,774 | 307,889 | 361,193 | 433,158 |
| Grants and subsidies | ||||
| Liabilities | 990,500 | 755,830 | 828,163 | 804,623 |
| Financial liabilities | 219,535 | 206,774 | 177,515 | 201,224 |
| Long-term liabilities | 291,984 | 440,820 | 486,901 | 463,624 |
| Short-term liabilities | 698,516 | 315,010 | 341,262 | 340,999 |
| Equity and liabilities | 1,425,728 | 1,078,457 | 1,207,780 | 1,248,263 |
| 2022-06 | 2023-06 | 2024-06 | 2025-06 | |
|---|---|---|---|---|
| Non-current assets | 669,519 | 729,384 | 771,162 | 878,406 |
| Intangible assets | 9,010 | 9,546 | 7,062 | 6,237 |
| Tangible assets | 624,938 | 678,463 | 726,391 | 779,189 |
| Financial assets | 830 | 15,902 | 17,861 | 55,629 |
| Other non-current assets | 34,741 | 25,473 | 19,848 | 37,351 |
| Current assets | 338,122 | 354,467 | 342,424 | 291,720 |
| Inventories and prepaid expenses | 19,008 | 10,441 | 5,948 | 6,861 |
| Accounts receivable in one year | 145,854 | 114,797 | 157,041 | 147,155 |
| Other current assets | 56,242 | 227,473 | 39,345 | 134,458 |
| Cash and cash equivalents | 117,018 | 1,756 | 140,090 | 3,246 |
| Total assets | 1,007,641 | 1,083,851 | 1,120,761 | 1,170,126 |
| Equity | 265,773 | 258,608 | 336,543 | 336,424 |
| Grants and subsidies | ||||
| Liabilities | 736,815 | 821,156 | 764,965 | 815,409 |
| Financial liabilities | 239,685 | 192,392 | 181,844 | 211,776 |
| Long-term liabilities | 346,267 | 359,464 | 475,753 | 505,943 |
| Short-term liabilities | 390,548 | 461,692 | 289,212 | 309,466 |
| Equity and liabilities | 1,007,641 | 1,083,851 | 1,120,761 | 1,170,126 |
Financial ratios
| 2022 | 2023 | 2024 | 2025 | |
|---|---|---|---|---|
| Capital return ratios | ||||
| Return on assets (ROA) | -4% | 4% | 5% | 3% |
| Return on equity (ROE) | -17% | 20% | 16% | 10% |
| Return on capital employed (ROCE) | -9% | 5% | 6% | 3% |
| Capital structure and liquidity ratios | ||||
| Debt / asset ratio (D/A) | 0.15 | 0.19 | 0.15 | 0.16 |
| Current Ratio | 1.03 | 1.02 | 1.19 | 0.84 |
| Quick ratio | 1.01 | 1.00 | 1.17 | 0.83 |
| Turnover ratios | ||||
| Asset turnover | 0.41 | 0.44 | 0.40 | 0.43 |
| Fixed asset turnover | 0.84 | 0.63 | 0.60 | 0.55 |
| Equity turnover | 2.59 | 1.56 | 1.33 | 1.23 |
| Profitability ratios | ||||
| EBITDA margin | -2% | 18% | 20% | 14% |
| Operating profit margin | -8% | 8% | 10% | 5% |
| Net profit margin | -7% | 11% | 11% | 7% |
| Other ratios | ||||
| Dividends to the State | 65.40 | 196.20 | 392.30 | 523.10 |
| Dividends paid / net profit | 0.00 | 0.00 | 0.01 | 0.01 |
| 2022-06 | 2023-06 | 2024-06 | 2025-06 | |
|---|---|---|---|---|
| Capital return ratios | ||||
| Return on assets (ROA) | 1% | -1% | 5% | -1% |
| Return on equity (ROE) | 3% | -2% | 18% | -5% |
| Return on capital employed (ROCE) | -1% | 6% | 4% | -6% |
| Capital structure and liquidity ratios | ||||
| Debt / asset ratio (D/A) | 0.24 | 0.18 | 0.16 | 0.18 |
| Current Ratio | 0.87 | 0.77 | 1.18 | 0.94 |
| Quick ratio | 0.82 | 0.75 | 1.16 | 0.92 |
| Turnover ratios | ||||
| Asset turnover | 0.23 | 0.20 | 0.22 | 0.22 |
| Fixed asset turnover | 0.34 | 0.30 | 0.32 | 0.29 |
| Equity turnover | 0.87 | 0.85 | 0.73 | 0.77 |
| Profitability ratios | ||||
| EBITDA margin | 6% | 24% | 23% | -10% |
| Operating profit margin | -2% | 16% | 13% | -19% |
| Net profit margin | -2% | 14% | 12% | -16% |
| Other ratios | ||||
| Dividends to the State | ||||
| Dividends paid / net profit |
Financial statments
Expectations of the state
About the company
- Official nameUAB „EPSO-G“ įmonių grupė
- Legal formPrivate limited liability company (UAB)
- Company code302826889
- SectorEnergy
- Line of businessGroup of energy enterprises
- Institution representing the StateMinistry of Energy
- Special obligationsPerformes non-commercial special obligations
- Share belonging to the State100%
- Contacts http://www.epsog.lt
Return to the State
523 EUR thousand
ROE
3.1%
Number of employees
1,396
Financial data provided as at end-December 2024
Management
- Mindaugas KeizerisChief Executive Officer
Term of office expires: 2027/08/22
The information is relevant
Board of Directors
CHAIRMAN OF THE BOARD OF DIRECTORS
- Robertas VyšniauskasIndependent member
MEMBERS OF THE BOARD OF DIRECTORS
- Dainius BražiūnasMinistry of Energy
- Rasa BalevičienėIndependent member
- Liudas LiutkevičiusIndependent member
- Dovilė KavaliauskienėMinistry of Energy
Term of office expires: 2027/03/24
The information is relevant


