Panevėžio veislininkystė
UAB Panevėžio veislininkystė was registered in 1992. It is a long-established company engaged in animal breeding, animal productivity control and animal insemination.
2021/22 GOOD CORPORATE GOVERNANCE INDEX
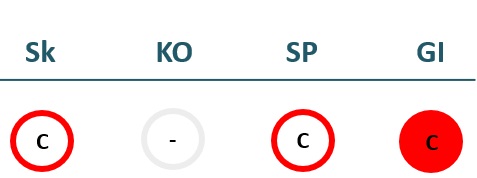
2020/21 GOOD CORPORATE GOVERNANCE INDEX
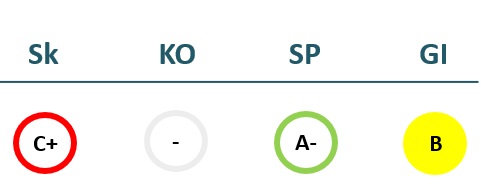
Sk – Transparency dimension
KO – Board dimension
SP – Strategic planning and target achievement dimension
GI – Good governance ratio
Financial results
P/L Statment
| 2020 | 2021 | 2022 | 2023 | |
|---|---|---|---|---|
| Revenue | 618 | 164 | ||
| Cost of goods sold | 476 | 101 | ||
| Gross profit (loss) | 142 | 64 | 0 | 0 |
| Gross profit margin | 23% | 39% | % | % |
| Operating expenses | 142 | 207 | ||
| Operating profit (loss) | 0 | -143 | 0 | 0 |
| Operating profit margin | 0% | -87% | % | % |
| EBITDA | 26 | -127 | 0 | 0 |
| EBITDA margin | 4% | -78% | % | % |
| Net profit (loss) | 14 | -139 | 0 | 0 |
| Net profit margin | 2% | -84% | % | % |
| 2020-06 | 2021-06 | 2022-06 | 2023-06 | |
|---|---|---|---|---|
| Revenue | 377 | 117 | 6 | |
| Cost of goods sold | 297 | 75 | 1 | |
| Gross profit (loss) | 80 | 42 | 5 | 0 |
| Gross profit margin | 21% | 36% | 90% | % |
| Operating expenses | 68 | 55 | 88 | 0 |
| Operating profit (loss) | 11 | -13 | -83 | 0 |
| Operating profit margin | 3% | -11% | -1375% | % |
| EBITDA | 66 | -2 | -48 | 0 |
| EBITDA margin | 18% | -2% | -802% | % |
| Net profit (loss) | 11 | -7 | -52 | 0 |
| Net profit margin | 3% | -6% | -860% | % |
Balance sheet
| 2020 | 2021 | 2022 | 2023 | |
|---|---|---|---|---|
| Non-current assets | 828 | 747 | 0 | 0 |
| Intangible assets | 0 | |||
| Tangible assets | 828 | 746 | ||
| Financial assets | 0 | 0 | ||
| Other non-current assets | ||||
| Current assets | 114 | 125 | 0 | 0 |
| Inventories and prepaid expenses | 64 | 59 | ||
| Accounts receivable in one year | 46 | 45 | ||
| Other current assets | ||||
| Cash and cash equivalents | 5 | 21 | ||
| Total assets | 943 | 872 | 0 | 0 |
| Equity | 146 | 7 | 0 | 0 |
| Grants and subsidies | 723 | 625 | ||
| Liabilities | 73 | 213 | 0 | 0 |
| Financial liabilities | 3 | 0 | 0 | 0 |
| Long-term liabilities | ||||
| Short-term liabilities | 73 | 213 | ||
| Equity and liabilities | 943 | 872 | 0 | 0 |
| 2020-06 | 2021-06 | 2022-06 | 2023-06 | |
|---|---|---|---|---|
| Non-current assets | 882 | 774 | 639 | 0 |
| Intangible assets | 0 | 0 | ||
| Tangible assets | 882 | 774 | 639 | |
| Financial assets | 0 | 0 | 0 | |
| Other non-current assets | 0 | |||
| Current assets | 59 | 86 | 72 | 0 |
| Inventories and prepaid expenses | 4 | 5 | 1 | |
| Accounts receivable in one year | 39 | 54 | 47 | |
| Other current assets | 0 | |||
| Cash and cash equivalents | 17 | 28 | 24 | |
| Total assets | 942 | 860 | 712 | 0 |
| Equity | 143 | 139 | -44 | 0 |
| Grants and subsidies | 773 | 674 | 576 | |
| Liabilities | 27 | 47 | 181 | 0 |
| Financial liabilities | 5 | 1 | 0 | 0 |
| Long-term liabilities | 3 | 0 | 0 | 0 |
| Short-term liabilities | 24 | 47 | 181 | 0 |
| Equity and liabilities | 942 | 860 | 712 | 0 |
Financial ratios
| 2020 | 2021 | 2022 | 2023 | |
|---|---|---|---|---|
| Capital return ratios | ||||
| Return on assets (ROA) | 1% | -15% | 0% | % |
| Return on equity (ROE) | 10% | -181% | 0% | % |
| Return on capital employed (ROCE) | 0% | -1938% | % | % |
| Capital structure and liquidity ratios | ||||
| Debt / asset ratio (D/A) | 0.00 | 0.00 | ||
| Current Ratio | 1.57 | 0.59 | ||
| Quick ratio | 0.69 | 0.31 | ||
| Turnover ratios | ||||
| Asset turnover | 0.66 | 0.19 | ||
| Fixed asset turnover | 0.75 | 0.22 | ||
| Equity turnover | 4.24 | 22.18 | ||
| Profitability ratios | ||||
| EBITDA margin | 4% | -78% | % | % |
| Operating profit margin | 0% | -87% | % | % |
| Net profit margin | 2% | -84% | % | % |
| Other ratios | ||||
| Dividends to the State | 0.00 | 0.00 | 0.00 | 0.00 |
| Dividends paid / net profit | 0.00 | 0.00 |
| 2020-06 | 2021-06 | 2022-06 | 2023-06 | |
|---|---|---|---|---|
| Capital return ratios | ||||
| Return on assets (ROA) | 5% | -0% | -23% | 14% |
| Return on equity (ROE) | 40% | -3% | -387% | -233% |
| Return on capital employed (ROCE) | 8% | -9% | 186% | % |
| Capital structure and liquidity ratios | ||||
| Debt / asset ratio (D/A) | 0.01 | 0.00 | 0.00 | |
| Current Ratio | 2.52 | 1.83 | 0.40 | |
| Quick ratio | 2.36 | 1.73 | 0.39 | |
| Turnover ratios | ||||
| Asset turnover | 0.40 | 0.14 | 0.01 | |
| Fixed asset turnover | 0.43 | 0.15 | 0.01 | |
| Equity turnover | 2.64 | 0.84 | -0.14 | |
| Profitability ratios | ||||
| EBITDA margin | 18% | -2% | -802% | % |
| Operating profit margin | 3% | -11% | -1375% | % |
| Net profit margin | 3% | -6% | -860% | % |
| Other ratios | ||||
| Dividends to the State | ||||
| Dividends paid / net profit |
Financial statments
2015 m. metinės ataskaitos
2015 m. 12 mėn. tarpinės ataskaitos
2015 m. 9 mėn. tarpinės ataskaitos
2015 m. 6 mėn. tarpinės ataskaitos
2015 m. 3 mėn. tarpinės ataskaitos
2014 m. metinės ataskaitos
2014 m. 12 mėn. tarpinės ataskaitos
2014 m. 9 mėn. tarpinės ataskaitos
2014 m. 6 mėn. tarpinės ataskaitos
2014 m. 3 mėn. tarpinės ataskaitos
Expectations of the state
About the company
- Official nameUAB „Panevėžio veislininkystė“
- Legal formPrivate limited liability company (UAB)
- Company code168559278
- SectorOther
- Line of businessActivity of services specific to animal husbandry, organization of breeding animal auctions, exhibitions and fairs, provision of cattle quarantine services to Lithuanian and foreign livestock breeders. As of today, the Company is not operating.
- Institution representing the StateProperty bank
- Share belonging to the State0%
ROE
0.0%
Financial data provided as at end-December 2023