Ignitis grupė

Ignitis Group is an international energy company and one of the largest energy groups in the Baltic States. Ignitis Group operates companies in Lithuania, Latvia, Estonia, Poland and Finland. The group’s main activities are the generation and supply of electricity and heat, the trading and distribution of electricity and natural gas, and the implementation of innovative energy solutions. In all its activities, Ignitis Group focuses on its commitment to creating an energy-smart world and a more sustainable future. Ignitis Group’s securities are traded on the Nasdaq Vilnius Stock Exchange and its international depositary receipts are traded on the London Stock Exchange.
2024/25 GOOD CORPORATE GOVERNANCE INDEX
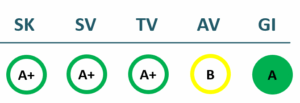
SK – Transparency Dimension
SV – Strategic Management Dimension
TV – Sustainability Dimension
AV – Shareholder Actions Dimension
GI – Good Governance Indicator
Financial results
P/L Statment
| 2022 | 2023 | 2024 | 2025 | |
|---|---|---|---|---|
| Revenue | 4,386,899 | 2,549,050 | 2,307,024 | 2,497,734 |
| Cost of goods sold | 3,608,723 | 1,757,691 | 1,444,691 | 1,625,067 |
| Gross profit (loss) | 778,176 | 791,359 | 862,333 | 872,667 |
| Gross profit margin | 18% | 31% | 37% | 35% |
| Operating expenses | 0 | 0 | 0 | 0 |
| Operating profit (loss) | 387,792 | 352,178 | 349,969 | 251,365 |
| Operating profit margin | 9% | 14% | 15% | 10% |
| EBITDA | 525,521 | 540,338 | 531,498 | 458,296 |
| EBITDA margin | 12% | 21% | 23% | 18% |
| Net profit (loss) | 293,435 | 320,201 | 276,154 | 163,936 |
| Net profit margin | 7% | 13% | 12% | 7% |
| 2022-06 | 2023-06 | 2024-06 | 2025-06 | |
|---|---|---|---|---|
| Revenue | 1,733,120 | 1,370,387 | 1,092,326 | 1,297,980 |
| Cost of goods sold | 1,367,625 | 1,003,003 | 646,070 | 849,417 |
| Gross profit (loss) | 365,495 | 367,384 | 446,256 | 448,563 |
| Gross profit margin | 21% | 27% | 41% | 35% |
| Operating expenses | 0 | 0 | 0 | 0 |
| Operating profit (loss) | 141,893 | 164,691 | 207,845 | 160,298 |
| Operating profit margin | 8% | 12% | 19% | 12% |
| EBITDA | 209,781 | 238,133 | 297,841 | 254,689 |
| EBITDA margin | 12% | 17% | 27% | 20% |
| Net profit (loss) | 114,832 | 155,696 | 168,360 | 111,376 |
| Net profit margin | 7% | 11% | 15% | 9% |
Balance sheet
| 2022 | 2023 | 2024 | 2025 | |
|---|---|---|---|---|
| Non-current assets | 3,249,138 | 4,215,954 | 4,750,795 | 5,281,282 |
| Intangible assets | 148,273 | 315,358 | 305,795 | 293,164 |
| Tangible assets | 2,810,936 | 3,362,533 | 4,027,441 | 4,699,245 |
| Financial assets | 28,930 | 113,265 | 62,632 | 51,790 |
| Other non-current assets | 3,249,138 | 4,215,954 | 4,750,795 | 5,281,282 |
| Current assets | 1,980,469 | 998,892 | 932,337 | 954,166 |
| Inventories and prepaid expenses | 656,978 | 284,185 | 258,220 | 246,081 |
| Accounts receivable in one year | 572,083 | 374,559 | 366,221 | 336,455 |
| Other current assets | 56,912 | 134,429 | 73,360 | 75,341 |
| Cash and cash equivalents | 694,062 | 205,261 | 234,536 | 296,289 |
| Total assets | 5,271,653 | 5,244,254 | 5,706,041 | 6,278,829 |
| Equity | 2,125,600 | 2,263,415 | 2,436,759 | 2,494,603 |
| Grants and subsidies | 296,804 | 300,062 | 287,514 | 272,451 |
| Liabilities | 2,388,533 | 2,259,670 | 2,512,763 | 2,891,758 |
| Financial liabilities | 1,680,974 | 1,633,159 | 1,846,790 | 2,208,279 |
| Long-term liabilities | 1,544,250 | 1,717,540 | 1,882,746 | 2,100,668 |
| Short-term liabilities | 844,283 | 542,130 | 630,017 | 791,090 |
| Equity and liabilities | 5,271,653 | 5,244,254 | 5,706,041 | 6,278,829 |
| 2022-06 | 2023-06 | 2024-06 | 2025-06 | |
|---|---|---|---|---|
| Non-current assets | 2,992,828 | 3,636,381 | 4,503,559 | 5,017,521 |
| Intangible assets | 119,176 | 180,237 | 323,291 | 305,740 |
| Tangible assets | 2,660,262 | 2,971,771 | 3,666,785 | 4,436,107 |
| Financial assets | 17,152 | 67,640 | 124,775 | 55,219 |
| Other non-current assets | 196,238 | 416,733 | 388,708 | 220,455 |
| Current assets | 1,250,979 | 1,385,886 | 820,894 | 837,108 |
| Inventories and prepaid expenses | 425,031 | 280,886 | 245,558 | 240,412 |
| Accounts receivable in one year | 463,669 | 359,966 | 277,926 | 249,783 |
| Other current assets | 16,112 | 18,792 | 21,244 | 74,050 |
| Cash and cash equivalents | 346,167 | 725,773 | 275,834 | 269,324 |
| Total assets | 4,614,467 | 5,049,667 | 5,366,093 | 5,897,272 |
| Equity | 2,127,779 | 2,083,595 | 2,369,441 | 2,491,962 |
| Grants and subsidies | 283,586 | 309,250 | 295,210 | 279,200 |
| Liabilities | 1,905,975 | 2,227,526 | 2,263,595 | 2,513,233 |
| Financial liabilities | 1,365,939 | 1,606,347 | 1,663,496 | 1,807,686 |
| Long-term liabilities | 1,388,382 | 1,646,189 | 1,749,944 | 1,779,751 |
| Short-term liabilities | 517,593 | 581,337 | 513,651 | 733,482 |
| Equity and liabilities | 4,614,467 | 5,049,667 | 5,366,093 | 5,897,272 |
Financial ratios
| 2022 | 2023 | 2024 | 2025 | |
|---|---|---|---|---|
| Capital return ratios | ||||
| Return on assets (ROA) | 6% | 6% | 5% | 3% |
| Return on equity (ROE) | 15% | 15% | 12% | 7% |
| Return on capital employed (ROCE) | 11% | 9% | 8% | 5% |
| Capital structure and liquidity ratios | ||||
| Debt / asset ratio (D/A) | 0.32 | 0.31 | 0.32 | 0.35 |
| Current Ratio | 2.35 | 1.84 | 1.48 | 1.21 |
| Quick ratio | 1.57 | 1.32 | 1.07 | 0.90 |
| Turnover ratios | ||||
| Asset turnover | 0.83 | 0.49 | 0.40 | 0.40 |
| Fixed asset turnover | 1.35 | 0.60 | 0.49 | 0.47 |
| Equity turnover | 2.06 | 1.13 | 0.95 | 1.00 |
| Profitability ratios | ||||
| EBITDA margin | 12% | 21% | 23% | 18% |
| Operating profit margin | 9% | 14% | 15% | 10% |
| Net profit margin | 7% | 13% | 12% | 7% |
| Other ratios | ||||
| Dividends to the State | 67,747.47 | 69,809.84 | 71,981.40 | 74,152.59 |
| Dividends paid / net profit | 0.23 | 0.22 | 0.26 | 0.45 |
| 2022-06 | 2023-06 | 2024-06 | 2025-06 | |
|---|---|---|---|---|
| Capital return ratios | ||||
| Return on assets (ROA) | 5% | 7% | 6% | 4% |
| Return on equity (ROE) | 11% | 16% | 15% | 9% |
| Return on capital employed (ROCE) | 4% | 4% | 5% | 4% |
| Capital structure and liquidity ratios | ||||
| Debt / asset ratio (D/A) | 0.33 | 0.34 | 0.31 | 0.32 |
| Current Ratio | 2.42 | 2.38 | 1.60 | 1.14 |
| Quick ratio | 1.60 | 1.90 | 1.12 | 0.81 |
| Turnover ratios | ||||
| Asset turnover | 0.38 | 0.27 | 0.20 | 0.22 |
| Fixed asset turnover | 0.58 | 0.38 | 0.24 | 0.26 |
| Equity turnover | 0.81 | 0.66 | 0.46 | 0.52 |
| Profitability ratios | ||||
| EBITDA margin | 12% | 17% | 27% | 20% |
| Operating profit margin | 8% | 12% | 19% | 12% |
| Net profit margin | 7% | 11% | 15% | 9% |
| Other ratios | ||||
| Dividends to the State | ||||
| Dividends paid / net profit |
Financial statments
Expectations of the state
About the company
- Official nameAB „Ignitis grupė“
- Legal formPrivate limited liability company (UAB)
- Company code301844044
- SectorEnergy
- Line of businessGroup of energy enterprises
- Institution representing the StateMinistry of Finance
- Share belonging to the State74.99%
- Contacts https://www.ignitisgrupe.lt/
Return to the State
74.2 EUR milion
ROE
2.7%
Number of employees
4,851
Financial data provided as at end-December 2024
Management
- Darius MaikštėnasChief Executive Officer
Term of office expires: 2027/02/28
The information is relevant
Board of Directors
CHAIRMAN OF THE BOARD OF DIRECTORS
- Darius MaikštėnasCEO
MEMBERS OF THE BOARD OF DIRECTORS
- Živilė SkibarkienėChief Organisational Development Officer
- Jonas RimavičiusChief Finance Officer
- Vytenis KoryznaChief Commercial Officer
- Mantas MikalajūnasChief Regulatory Officer
Term of office expires: 2030/03/25
The information is relevant
Supervisory board
CHAIRMAN OF THE SUPERVISORY BOARD
- Alfonso Maximiliano Faubel FrauendorffIndependent member
SUPERVISORY BOARD MEMBERS
- Judith BussIndependent member
- Lorraine Mary WrafterIndependent member
- Timothy Guy BrooksIndependent member
- Aušra VičkačkienėMinistry of Finance
- Ingrida MuckutėMinistry of Finance
- Sian Lloyd ReesIndependent member
- Jutta Maria Hildegard DissenIndependent member
- Lina LiubauskaitėGovernment of the Republic of Lithuania
Term of office expires: 2029/10/26
The information is relevant


