Via Lietuva
The joint-stock company „Via Lietuva” was transformed from a state enterprise on 2 January, 2023. After the transformation, the company remains on the list of companies of national security importance, managing roads of national importance on a trust basis. The mission of the Road Directorate is to create and ensure for the public safe, comfortable, environmentally friendly and intelligent transport on Lithuanian roads.
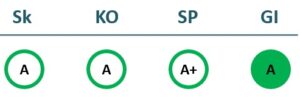
2022/23 GOOD CORPORATE GOVERNANCE INDEX
2021/22 GOOD CORPORATE GOVERNANCE INDEX
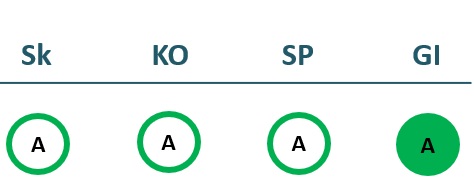
Sk – Transparency dimension
KO – Board dimension
SP – Strategic planning and target achievement dimension
GI – Good governance ratio
Financial results
P/L Statment
| 2020 | 2021 | 2022 | 2023 | |
|---|---|---|---|---|
| Revenue | 3,975 | 10,699 | 13,123 | 17,353 |
| Cost of goods sold | 3,776 | 10,301 | 0 | 0 |
| Gross profit (loss) | 199 | 398 | 13,123 | 17,353 |
| Gross profit margin | 5% | 4% | 100% | 100% |
| Operating expenses | 13,003 | 16,484 | ||
| Operating profit (loss) | 199 | 398 | 120 | 869 |
| Operating profit margin | 5% | 4% | 1% | 5% |
| EBITDA | 560 | 1,702 | 2,236 | 3,559 |
| EBITDA margin | 14% | 16% | 17% | 21% |
| Net profit (loss) | 940 | 2,340 | 328 | 1,556 |
| Net profit margin | 24% | 22% | 2% | 9% |
| 2020-06 | 2021-06 | 2022-06 | 2023-06 | |
|---|---|---|---|---|
| Revenue | 6,686 | 7,887 | 8,178 | |
| Cost of goods sold | 4,979 | 5,828 | 7,769 | |
| Gross profit (loss) | 0 | 1,707 | 2,060 | 409 |
| Gross profit margin | % | 26% | 26% | 5% |
| Operating expenses | 0 | 0 | 0 | 0 |
| Operating profit (loss) | 0 | 1,707 | 2,060 | 409 |
| Operating profit margin | % | 26% | 26% | 5% |
| EBITDA | 0 | 3,955 | -673 | 2,300 |
| EBITDA margin | % | 59% | -9% | 28% |
| Net profit (loss) | 0 | 2,909 | 73 | 866 |
| Net profit margin | % | 44% | 1% | 11% |
Balance sheet
| 2020 | 2021 | 2022 | 2023 | |
|---|---|---|---|---|
| Non-current assets | 3,230,581 | 3,425,988 | 25,505 | 28,372 |
| Intangible assets | 3,142 | 3,476 | 2,345 | 2,251 |
| Tangible assets | 3,227,439 | 3,422,512 | 9,268 | 12,721 |
| Financial assets | 0 | 13,722 | 13,240 | |
| Other non-current assets | 0 | 171 | 160 | |
| Current assets | 47,480 | 51,086 | 58,725 | 92,962 |
| Inventories and prepaid expenses | 1,892 | 395 | 42 | 63 |
| Accounts receivable in one year | 38,427 | 30,604 | 45,852 | 74,502 |
| Other current assets | 0 | 0 | 0 | |
| Cash and cash equivalents | 7,161 | 20,087 | 12,831 | 18,397 |
| Total assets | 3,278,740 | 3,477,902 | 84,402 | 121,551 |
| Equity | 2,693,140 | 2,606,740 | 13,145 | 14,705 |
| Grants and subsidies | 528,524 | 808,059 | 1,398 | 1,786 |
| Liabilities | 57,075 | 63,103 | 69,597 | 104,762 |
| Financial liabilities | 458 | 485 | 45 | 1,588 |
| Long-term liabilities | 10,451 | 9,928 | 17,257 | 15,568 |
| Short-term liabilities | 46,624 | 53,175 | 52,340 | 89,194 |
| Equity and liabilities | 3,278,740 | 3,477,902 | 84,402 | 121,551 |
| 2020-06 | 2021-06 | 2022-06 | 2023-06 | |
|---|---|---|---|---|
| Non-current assets | 0 | 3,312,419 | 3,406,520 | 23,802 |
| Intangible assets | 3,450 | 2,860 | 4,312 | |
| Tangible assets | 3,308,969 | 3,403,660 | 10,157 | |
| Financial assets | 9,333 | |||
| Other non-current assets | 0 | |||
| Current assets | 0 | 94,031 | 67,937 | 86,320 |
| Inventories and prepaid expenses | 2,117 | 492 | 3,902 | |
| Accounts receivable in one year | 86,497 | 58,078 | 59,976 | |
| Other current assets | 9,367 | 0 | ||
| Cash and cash equivalents | 5,417 | 22,441 | ||
| Total assets | 0 | 3,407,283 | 3,475,407 | 110,804 |
| Equity | 0 | 2,649,802 | 2,673,478 | 16,904 |
| Grants and subsidies | 654,562 | 720,661 | 3,589 | |
| Liabilities | 0 | 102,918 | 79,481 | 84,231 |
| Financial liabilities | 0 | 0 | 0 | 511 |
| Long-term liabilities | 0 | 10,213 | 9,719 | 9,333 |
| Short-term liabilities | 0 | 92,705 | 69,762 | 74,898 |
| Equity and liabilities | 0 | 3,407,283 | 3,475,407 | 110,804 |
Financial ratios
| 2020 | 2021 | 2022 | 2023 | |
|---|---|---|---|---|
| Capital return ratios | ||||
| Return on assets (ROA) | 0% | 0% | 0% | 2% |
| Return on equity (ROE) | 0% | 0% | 0% | 11% |
| Return on capital employed (ROCE) | 0% | 0% | 0% | 3% |
| Capital structure and liquidity ratios | ||||
| Debt / asset ratio (D/A) | 0.00 | 0.00 | 0.00 | 0.01 |
| Current Ratio | 1.02 | 0.96 | 1.12 | 1.04 |
| Quick ratio | 0.98 | 0.95 | 1.12 | 1.04 |
| Turnover ratios | ||||
| Asset turnover | 0.00 | 0.00 | 0.16 | 0.14 |
| Fixed asset turnover | 0.00 | 0.00 | 0.51 | 0.61 |
| Equity turnover | 0.00 | 0.00 | 1.00 | 1.18 |
| Profitability ratios | ||||
| EBITDA margin | 14% | 16% | 17% | 21% |
| Operating profit margin | 5% | 4% | 1% | 5% |
| Net profit margin | 24% | 22% | 2% | 9% |
| Other ratios | ||||
| Dividends to the State | 1,154.00 | 2,104.00 | 0.00 | 0.00 |
| Dividends paid / net profit | 1.23 | 0.90 | 0.00 | 0.00 |
| 2021-06 | 2022-06 | 2023-06 | |
|---|---|---|---|
| Capital return ratios | |||
| Return on assets (ROA) | 0% | -0% | 0% |
| Return on equity (ROE) | 0% | -0% | 0% |
| Return on capital employed (ROCE) | 0% | 0% | 2% |
| Capital structure and liquidity ratios | |||
| Debt / asset ratio (D/A) | 0.00 | 0.00 | 0.00 |
| Current Ratio | 1.01 | 0.97 | 1.15 |
| Quick ratio | 0.99 | 0.97 | 1.10 |
| Turnover ratios | |||
| Asset turnover | 0.00 | 0.00 | 0.07 |
| Fixed asset turnover | 0.00 | 0.00 | 0.34 |
| Equity turnover | 0.00 | 0.00 | 0.48 |
| Profitability ratios | |||
| EBITDA margin | 59% | -9% | 28% |
| Operating profit margin | 26% | 26% | 5% |
| Net profit margin | 44% | 1% | 11% |
| Other ratios | |||
| Dividends to the State | |||
| Dividends paid / net profit |
Expectations of the state
About the company
- Official nameAB „Via Lietuva“
- Legal formPublic limited liability company (AB)
- Company code188710638
- SectorOther
- Line of businessRestoration, maintenance and development of state roads
- Institution representing the StateMinistry of Transport and Communications
- Special obligationsPerformes non-commercial special obligations
- Share belonging to the State100%
ROE
11.2%
Number of employees
298
Financial data provided as at end-December 2023
Management
- Marius ŠvaikauskasChief Executive Officer
Information as of: 2024/07/01
Board of Directors
CHAIRMAN OF THE BOARD OF DIRECTORS
- Vaidotas BalynasIndependent member; UAB Gelex; UAB Plungės vandenys, UAB Elektrėnų komunalinis ūkis
MEMBERS OF THE BOARD OF DIRECTORS
- Agnė Amelija MikalonėMinistry of Transport and Communications; AB Lietuvos geležinkeliai
- Rūta Butautaitė-PivoriūnienėIndependent member; UAB Nasdaq Vilnius Services
- Tadas JagminasIndependent member; Investuok Lietuvoje Director of Project Management Department
Information as of: 2024/07/01