VIAMATIKA

The company was founded on July 2, 1991 as the state road company Problematika. On March 14, 1995, the legal form was changed to a State Enterprise. As of April 1, 2011, the State Enterprise was transformed into a joint stock company. On July 7, 2021, the name of the company was changed to VIAMATIKA.
Areas of activity of the company:
– testing and analysis of the quality of road construction materials, products;
– maintenance of roads, bridges, airports, railways and other objects belonging to the group of transport communications;
– certification of construction products;
– cadastral surveys;
– other engineering-technological activities.
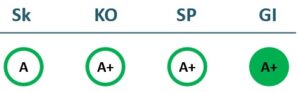
2022/23 GOOD CORPORATE GOVERNANCE INDEX
2021/22 GOOD CORPORATE GOVERNANCE INDEX
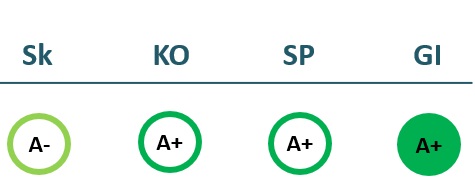
Sk – Transparency dimension
KO – Board dimension
SP – Strategic planning and target achievement dimension
GI – Good governance ratio
Financial results
P/L Statment
| 2019 | 2020 | 2021 | 2022 | |
|---|---|---|---|---|
| Revenue | 5,472 | 5,748 | 4,744 | 4,913 |
| Cost of goods sold | 2,495 | 2,639 | 2,596 | 2,833 |
| Gross profit (loss) | 2,977 | 3,108 | 2,148 | 2,080 |
| Gross profit margin | 54% | 54% | 45% | 42% |
| Operating expenses | 902 | 974 | 992 | 1,023 |
| Operating profit (loss) | 1,411 | 1,635 | 619 | 383 |
| Operating profit margin | 26% | 28% | 13% | 8% |
| EBITDA | 1,945 | 2,234 | 1,220 | 979 |
| EBITDA margin | 36% | 39% | 26% | 20% |
| Net profit (loss) | 1,180 | 1,487 | 631 | 426 |
| Net profit margin | 22% | 26% | 13% | 9% |
| 2020-06 | 2021-06 | 2022-06 | 2023-06 | |
|---|---|---|---|---|
| Revenue | 1,691 | 1,837 | 1,275 | 3,232 |
| Cost of goods sold | 947 | 1,094 | 1,209 | 1,619 |
| Gross profit (loss) | 744 | 743 | 66 | 1,613 |
| Gross profit margin | 44% | 40% | 5% | 50% |
| Operating expenses | 438 | 430 | 469 | 449 |
| Operating profit (loss) | 60 | 55 | -726 | 861 |
| Operating profit margin | 4% | 3% | -57% | 27% |
| EBITDA | 373 | 335 | -419 | 1,137 |
| EBITDA margin | 22% | 18% | -33% | 35% |
| Net profit (loss) | 135 | 92 | -645 | 920 |
| Net profit margin | 8% | 5% | -51% | 28% |
Balance sheet
| 2019 | 2020 | 2021 | 2022 | |
|---|---|---|---|---|
| Non-current assets | 6,061 | 5,767 | 5,439 | 5,098 |
| Intangible assets | 14 | 3 | 4 | 1 |
| Tangible assets | 5,906 | 5,622 | 5,307 | 4,991 |
| Financial assets | 0 | |||
| Other non-current assets | 142 | 141 | 128 | 106 |
| Current assets | 1,823 | 2,262 | 1,157 | 1,320 |
| Inventories and prepaid expenses | 60 | 39 | 9 | 5 |
| Accounts receivable in one year | 371 | 434 | 877 | 1,216 |
| Other current assets | 0 | |||
| Cash and cash equivalents | 1,393 | 1,789 | 271 | 98 |
| Total assets | 7,919 | 8,076 | 6,694 | 6,506 |
| Equity | 6,112 | 6,493 | 5,417 | 5,212 |
| Grants and subsidies | ||||
| Liabilities | 1,807 | 1,555 | 1,263 | 1,237 |
| Financial liabilities | 1,205 | 938 | 760 | 711 |
| Long-term liabilities | 42 | 668 | 524 | 381 |
| Short-term liabilities | 1,765 | 887 | 739 | 856 |
| Equity and liabilities | 7,919 | 8,076 | 6,694 | 6,506 |
| 2020-06 | 2021-06 | 2022-06 | 2023-06 | |
|---|---|---|---|---|
| Non-current assets | 5,879 | 5,457 | 5,316 | 4,918 |
| Intangible assets | 8 | 2 | 2 | 1 |
| Tangible assets | 5,729 | 5,313 | 5,186 | 4,811 |
| Financial assets | 0 | 0 | 0 | 0 |
| Other non-current assets | 142 | 141 | 128 | 106 |
| Current assets | 896 | 1,452 | 1,212 | 2,586 |
| Inventories and prepaid expenses | 65 | 239 | 16 | 24 |
| Accounts receivable in one year | 818 | 1,177 | 1,156 | 2,089 |
| Other current assets | 0 | 0 | 0 | 0 |
| Cash and cash equivalents | 12 | 36 | 40 | 472 |
| Total assets | 6,825 | 6,980 | 6,617 | 7,599 |
| Equity | 5,142 | 4,894 | 4,141 | 5,821 |
| Grants and subsidies | 0 | 0 | 0 | 0 |
| Liabilities | 1,683 | 2,061 | 2,462 | 1,723 |
| Financial liabilities | 1,116 | 1,056 | 1,209 | 425 |
| Long-term liabilities | 42 | 668 | 557 | 381 |
| Short-term liabilities | 1,641 | 1,393 | 1,905 | 1,342 |
| Equity and liabilities | 6,825 | 6,980 | 6,617 | 7,599 |
Financial ratios
| 2019 | 2020 | 2021 | 2022 | |
|---|---|---|---|---|
| Capital return ratios | ||||
| Return on assets (ROA) | 15% | 19% | 9% | 6% |
| Return on equity (ROE) | 19% | 24% | 11% | 8% |
| Return on capital employed (ROCE) | 23% | 23% | 10% | 7% |
| Capital structure and liquidity ratios | ||||
| Debt / asset ratio (D/A) | 0.15 | 0.12 | 0.11 | 0.11 |
| Current Ratio | 1.03 | 2.55 | 1.56 | 1.54 |
| Quick ratio | 1.00 | 2.51 | 1.55 | 1.54 |
| Turnover ratios | ||||
| Asset turnover | 0.69 | 0.71 | 0.71 | 0.76 |
| Fixed asset turnover | 0.90 | 1.00 | 0.87 | 0.96 |
| Equity turnover | 0.90 | 0.89 | 0.88 | 0.94 |
| Profitability ratios | ||||
| EBITDA margin | 36% | 39% | 26% | 20% |
| Operating profit margin | 26% | 28% | 13% | 8% |
| Net profit margin | 22% | 26% | 13% | 9% |
| Other ratios | ||||
| Dividends to the State | 1,105.99 | 1,706.00 | 631.00 | 310.90 |
| Dividends paid / net profit | 0.94 | 1.15 | 1.00 | 0.73 |
| 2020-06 | 2021-06 | 2022-06 | 2023-06 | |
|---|---|---|---|---|
| Capital return ratios | ||||
| Return on assets (ROA) | 17% | 21% | -2% | 28% |
| Return on equity (ROE) | 24% | 29% | -2% | 40% |
| Return on capital employed (ROCE) | 1% | 1% | -15% | 14% |
| Capital structure and liquidity ratios | ||||
| Debt / asset ratio (D/A) | 0.16 | 0.15 | 0.18 | 0.06 |
| Current Ratio | 0.55 | 1.04 | 0.64 | 1.93 |
| Quick ratio | 0.51 | 0.87 | 0.63 | 1.91 |
| Turnover ratios | ||||
| Asset turnover | 0.25 | 0.26 | 0.19 | 0.43 |
| Fixed asset turnover | 0.29 | 0.34 | 0.24 | 0.66 |
| Equity turnover | 0.33 | 0.38 | 0.31 | 0.56 |
| Profitability ratios | ||||
| EBITDA margin | 22% | 18% | -33% | 35% |
| Operating profit margin | 4% | 3% | -57% | 27% |
| Net profit margin | 8% | 5% | -51% | 28% |
| Other ratios | ||||
| Dividends to the State | ||||
| Dividends paid / net profit |
Financial statments
Expectations of the state
About the company
- Official nameAB „VIAMATIKA“
- Legal formPublic limited liability company (AB)
- Company code120721845
- SectorOther
- Line of businessConstruction analytics
- Institution representing the StateMinistry of Transport and Communications
- Share belonging to the State100%
Return to the State
311 EUR thousand
ROE
8.0%
Number of employees
92
Financial data provided as at end-December 2022
Management
- Anatolijus JadovasChief Executive officer
Information as of: 2024/04/02
Board of Directors
CHAIRMAN OF THE BOARD OF DIRECTORS
- Paulius ArštikysIndependent member; UAB Pažinimo medis; UAB Švykų ministerija
MEMBERS OF THE BOARD OF DIRECTORS
- Rolandas OginskasIndependent member; AB LTG Infra
- Evelina VerikienėMinistry of Transport and Communications; UAB Lutama
Information as of: 2024/04/02